Portal Guide

This section introduces the main areas of the admin portal and provides a detailed overview of the pages and features available to every user.
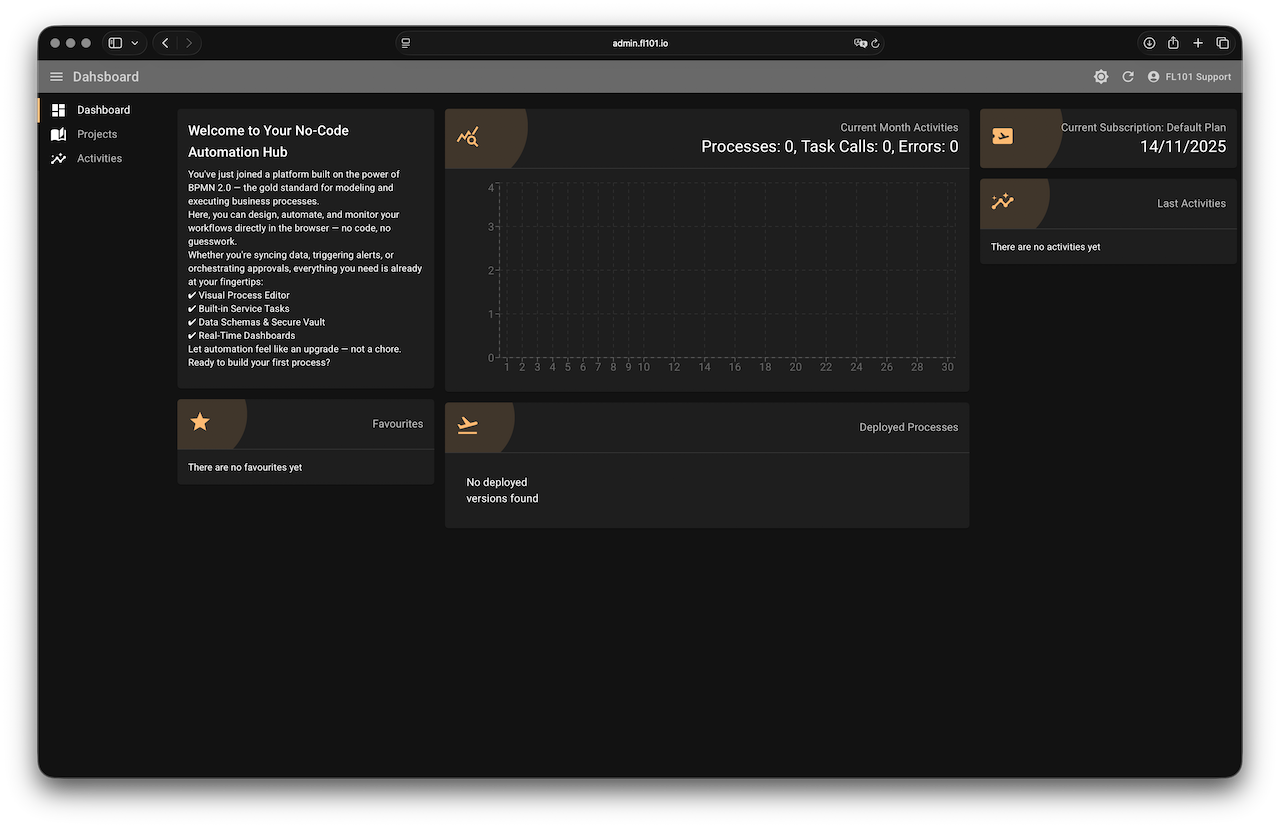
Dashboard
The Dashboard is the first page you see after logging in. It presents a collection of helpful widgets designed to give you a quick overview of your team’s activity. On the left side, you'll find the Notes widget, which highlights important announcements and platform updates, followed by the Favourites widget — your personalized shortcuts to frequently used resources. In the center column, there’s a bar chart visualizing current month activity. It tracks daily counts of service task executions and errors, along with a monthly total. Just beneath it, a list of your deployed processes provides direct access to process operations. On the right-hand side, the Last Activities list displays the 10 most recent events from your running processes, making it easy to stay informed at a glance.
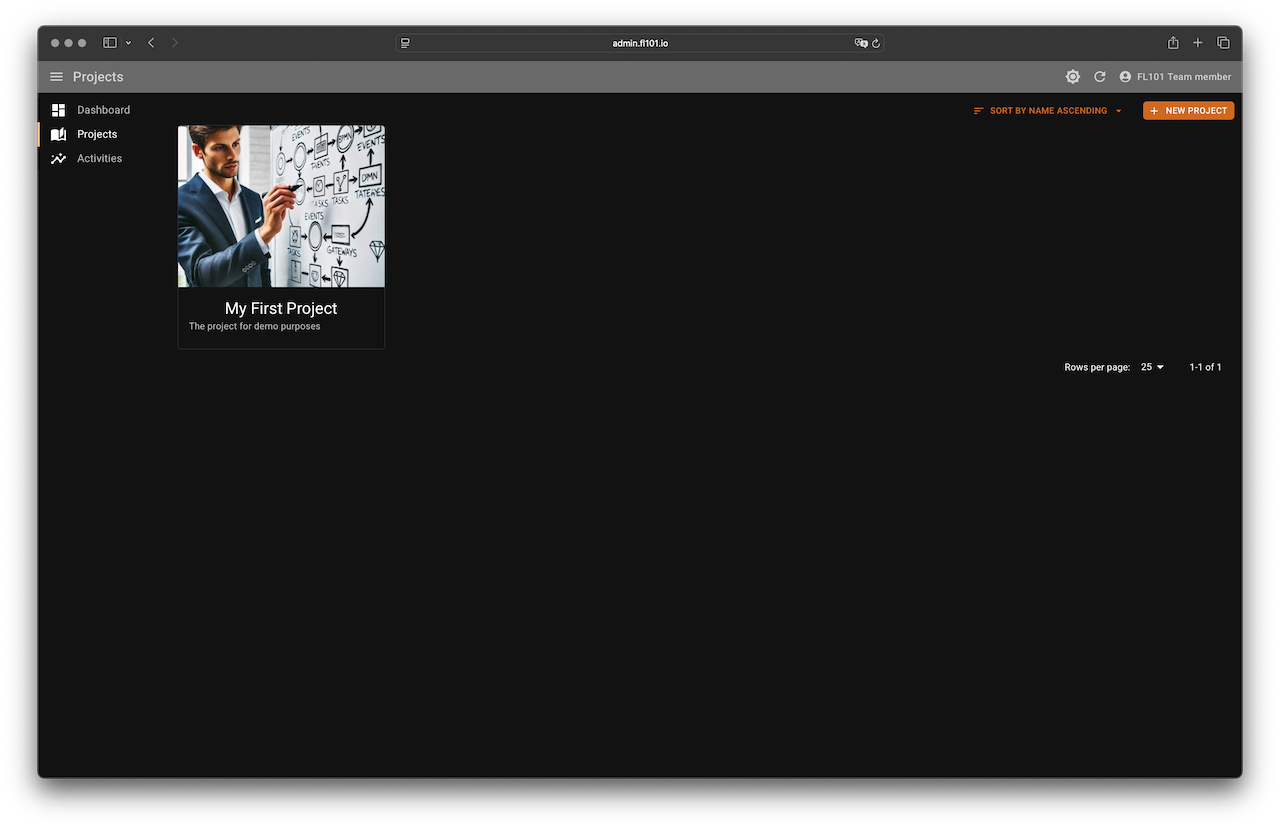
Projects
The Projects page displays all the projects available to you, whether created by you or shared within your team. You can sort projects by name and create new ones with a simple click. When creating a new project, only the name is required — optional fields include a project description and a representative image. Projects serve as containers for all your automation work, bringing together processes, data schemas, and secrets vault into a unified space.
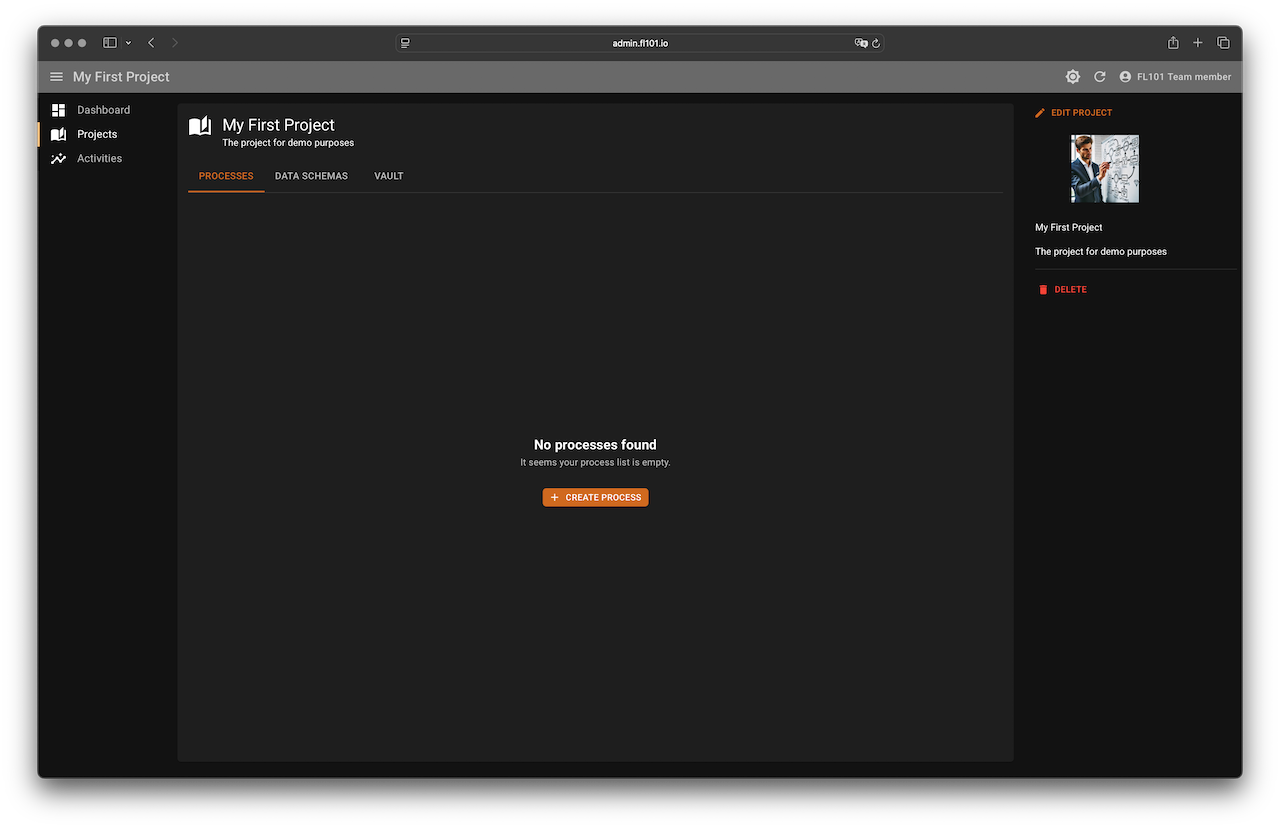
Project: Processes, Data Schemas, Vault, and Templates
Once a project is created, you can begin organizing its core components. From the project page, you can create new processes, define data schemas to store persistent information, manage credentials and API keys in the secure vault, and build reusable templates for emails, notifications, and prompts.
Each project maintains its own list of templates, allowing you to tailor content generation to the specific workflows and data used within that project.
While processes are created from the project page, their structure and logic are defined later using the dedicated process modeler. You can also update the project’s name, description, and image at any time. And when a project is no longer needed, it can be safely deleted along with all its associated resources in one step.
Process: Modeler, Info, and Deployments
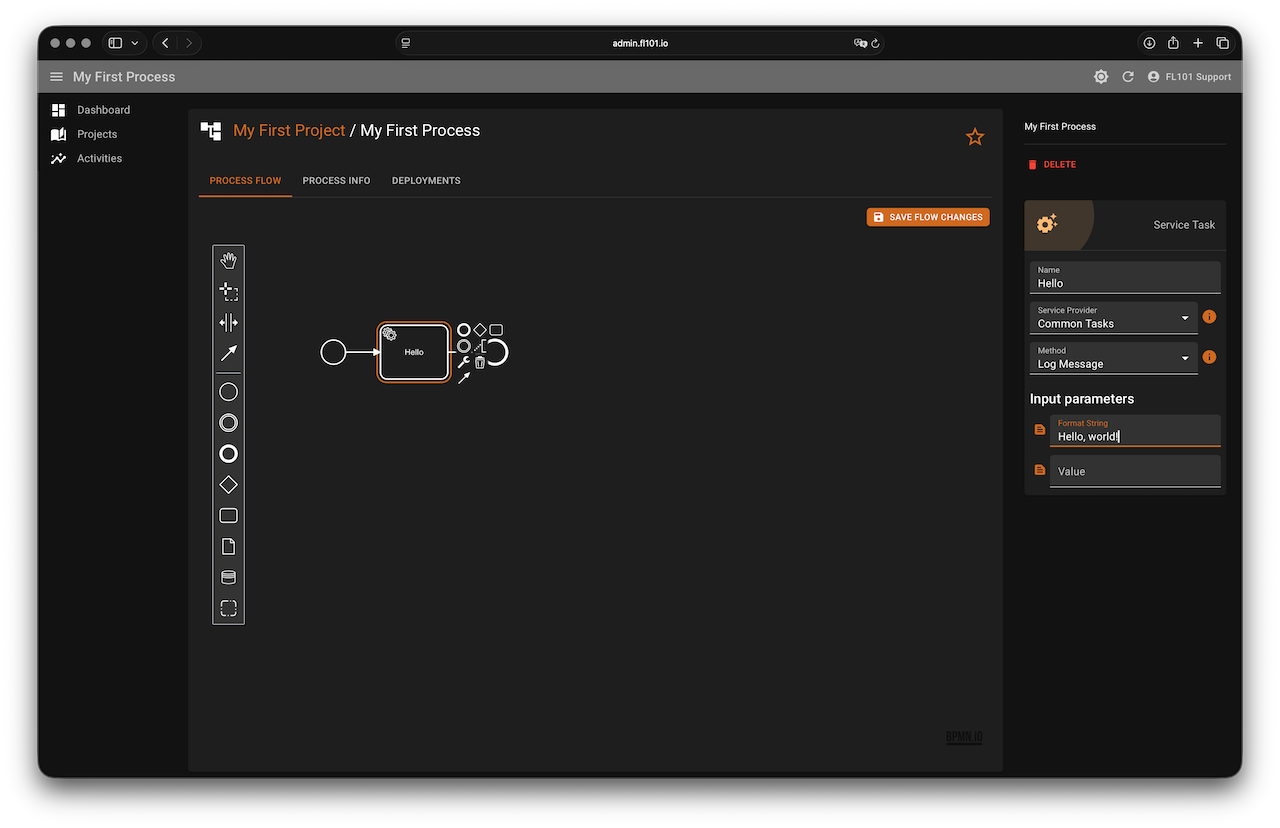
When you add a new process, the platform opens the built-in modeler, enabling you to design a BPMN 2.0-compliant process. The modeler includes a palette on the left with available BPMN elements — these are described in more detail in the BPMN 2.0 Compatibility section. On the right, a dynamic properties panel appears whenever you select an element, allowing you to edit its configuration. Additionally, a context menu lets you append elements, change element types, create connections, or delete components quickly and intuitively.
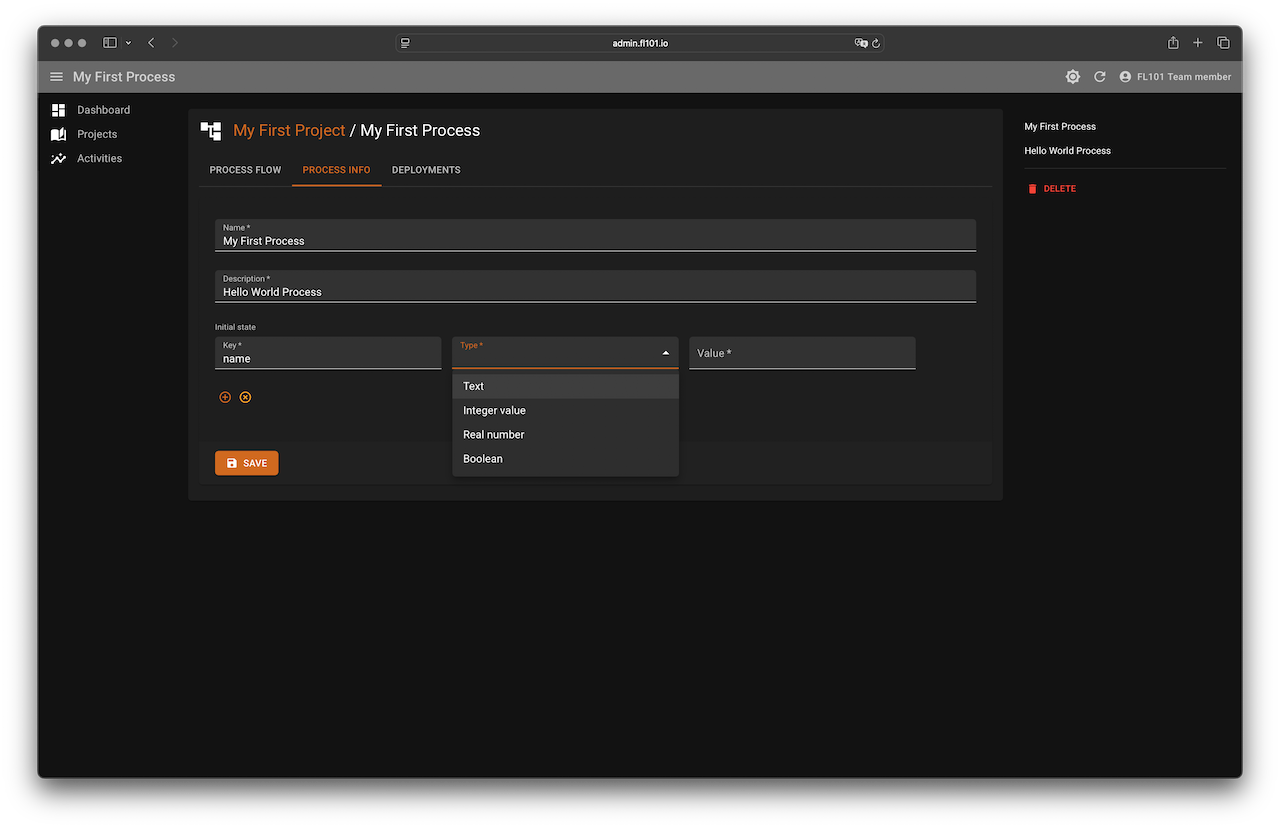
The Process Info tab allows you to update the process’s name and description and define an initial state — a collection of optional, typed key-value pairs. These values do not drive execution directly; instead, they serve as a base for generating the execution state when a process instance is launched. The available types include Text, Integer, Real Number, and Boolean. These values can be referenced during execution, for example as input parameters to service tasks. JSON Path is used to access them — if the state includes a "name" property at the root, it can be referenced as $.name. The section Execution State explains this mechanism in greater detail.
The Deployments tab lets you create and manage deployments of your process. Each deployment can be given a name, and you may override the default initial state if needed. Once deployed, you can start, suspend, resume, or edit the deployment, and view its execution history in the activities list. If your process starts with a regular Start Event, the instance will wait until you manually trigger it via the Start button. However, if your flow includes a Message Start Event or Timer Start Event, it can begin automatically based on those triggers.

Activities
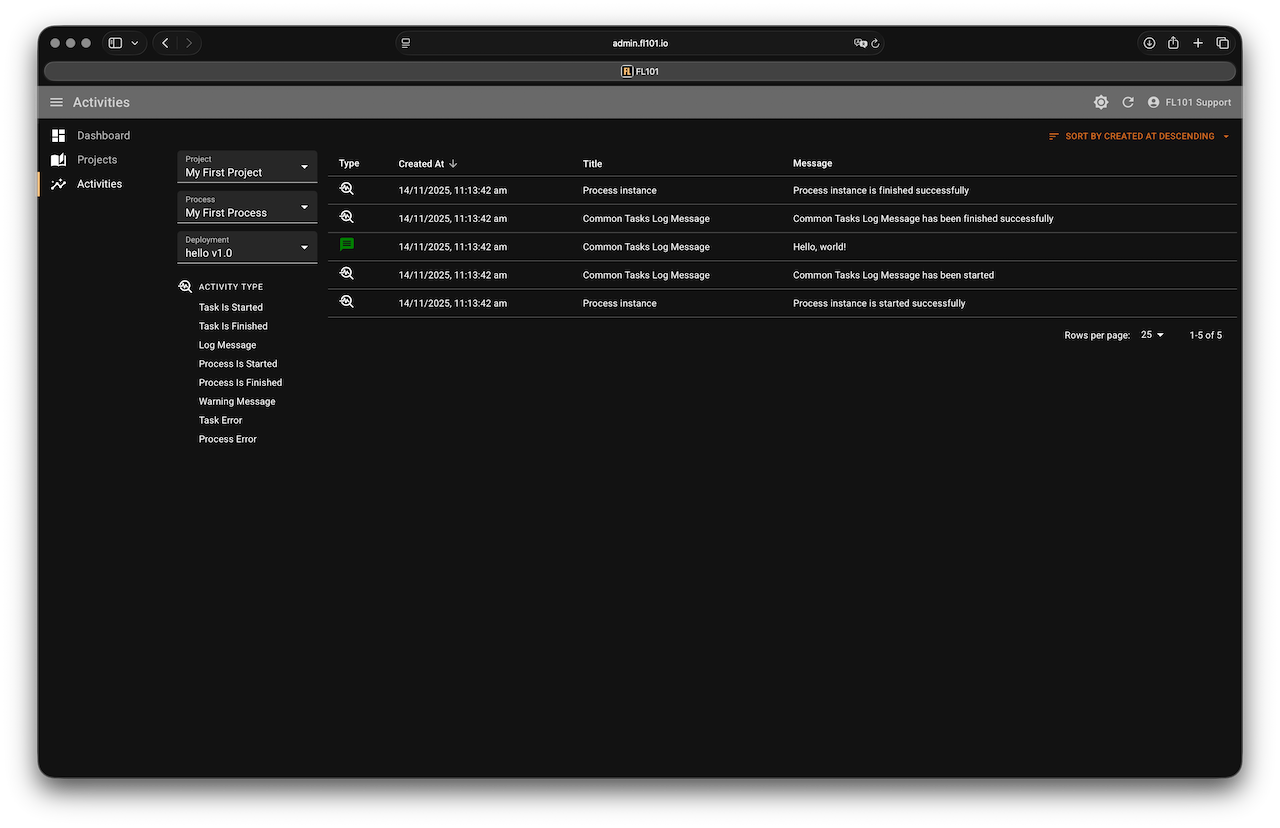
You can reach the Activities page in two ways. The first is by clicking the Activities button on a specific deployment within a process — this opens a filtered view showing activity logs for that deployment. The second way is through the left-hand navigation menu, which opens the full Activities dashboard. From there, you can filter activity logs by project, process, or specific deployment, making it easy to trace executions, debug issues, and monitor performance across your entire workspace.
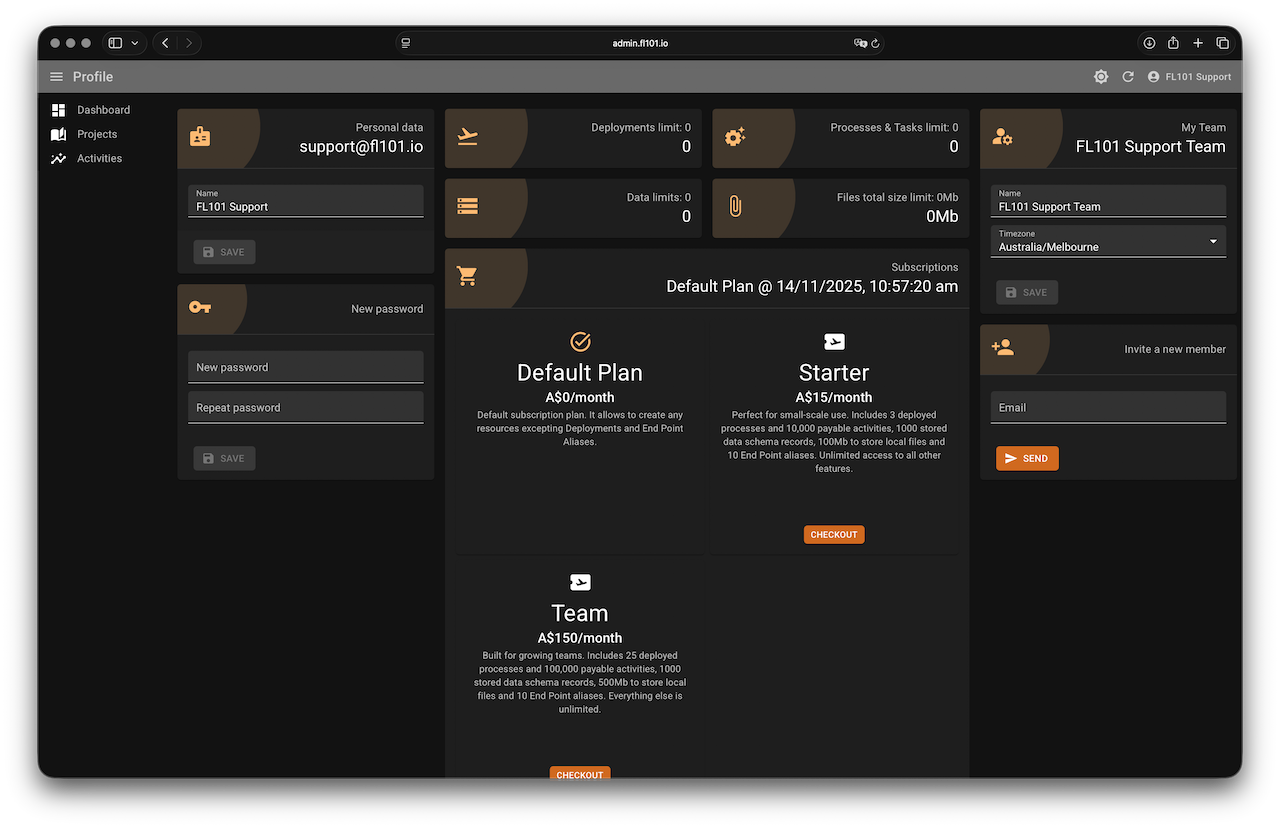
Profile
The Profile page is divided into three sections. On the left, you can update your name and change your password. In the center, you’ll find your current subscription plan with the option to upgrade or downgrade. On the right, you can edit your team’s name and time zone — the time zone is used specifically to ensure accurate tracking of usage limits, such as daily or monthly activity caps. Keeping this information up to date helps ensure your workspace runs smoothly and reflects your current organization structure.