Simple Trading Bot

Have you ever opened a workflow with hundreds of tasks and felt completely lost? It’s hard to understand, modify, test, or trust something that complex. That’s why, whenever possible, it’s better to break complicated automation into several smaller, independent processes that are easy to read, test, and maintain.
This use case shows exactly how to do that on the FL101 platform by building a simple (yet fully functional) trading bot based on the classic EMA crossover strategy.
Disclaimer: This example is for educational purposes only and demonstrates FL101 capabilities. FL101 is not a financial advisor. Always consult a professional before making trading decisions and never risk money you cannot afford to lose.
Overview – What the Bot Does
The bot consists of three independent processes that work together:
- Indicators – fetches candlestick data from Binance every minute and calculates short & long EMAs
- Signals – detects EMA crossovers (and can easily be extended to RSI, MACD, etc.)
- Cleanup – removes old indicator rows to keep the spreadsheet tidy
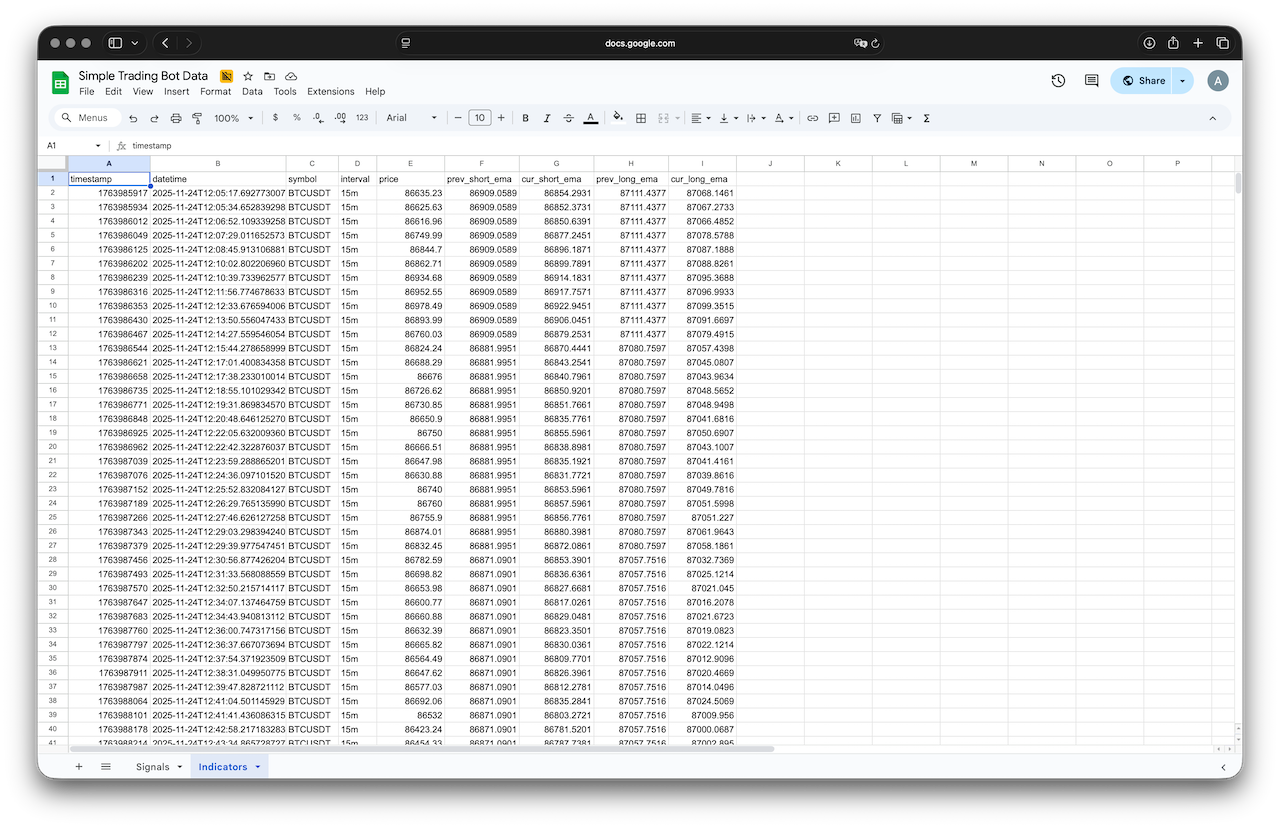
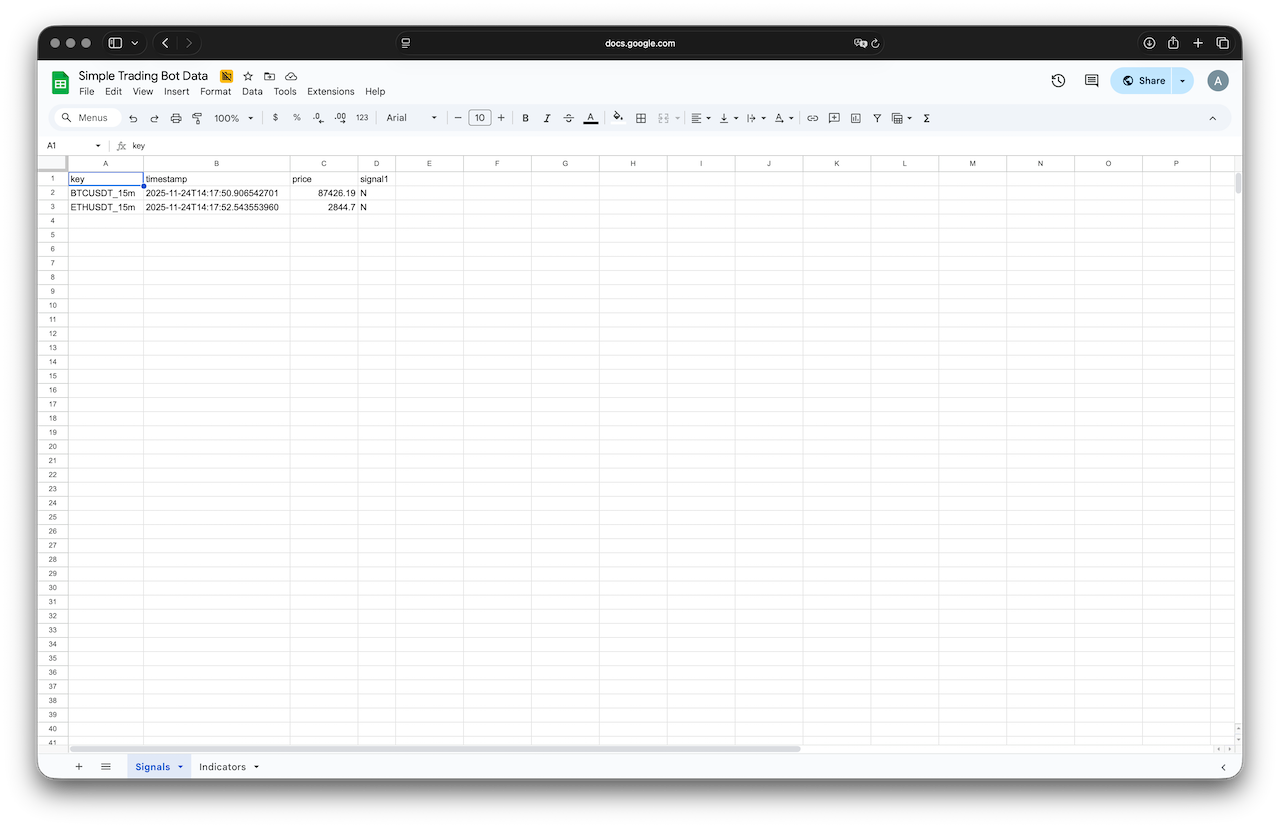
All data is stored in a single Google Spreadsheet that everyone can view and that FL101 can edit.
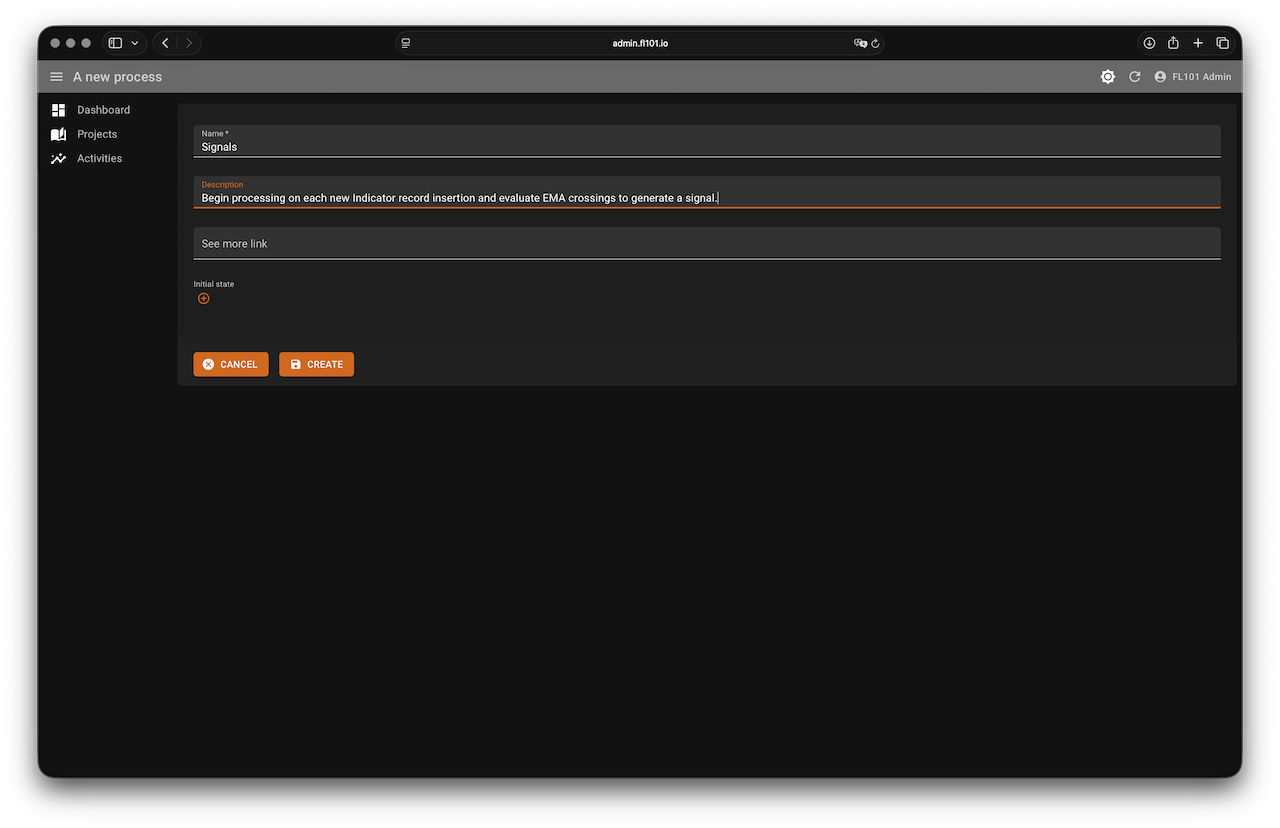
Step 1 – Prepare the Google Spreadsheet & Context
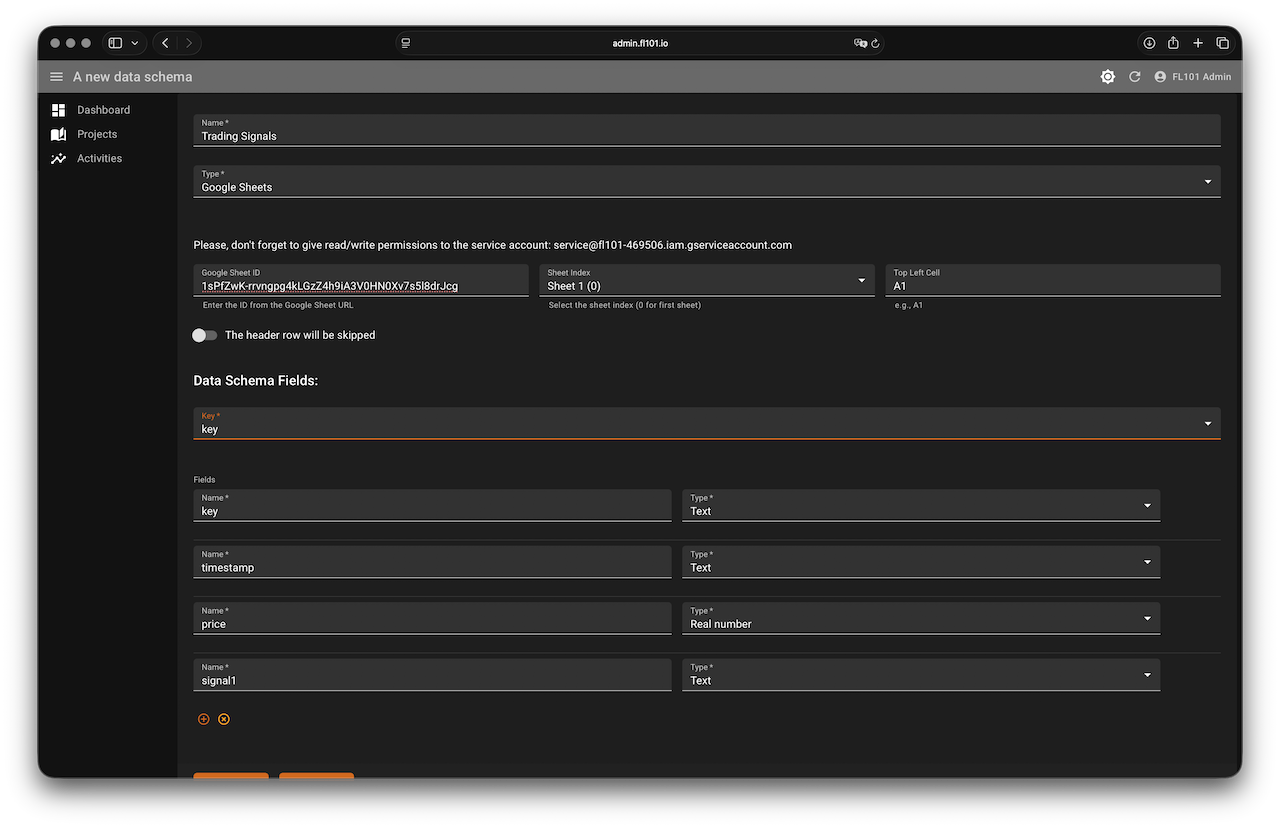
We’ll use this shared spreadsheet to store indicators and signals:
https://docs.google.com/spreadsheets/d/1sPfZwK-rrvngpg4kLGzZ4h9iA3V0HN0Xv7s5l8drJcg
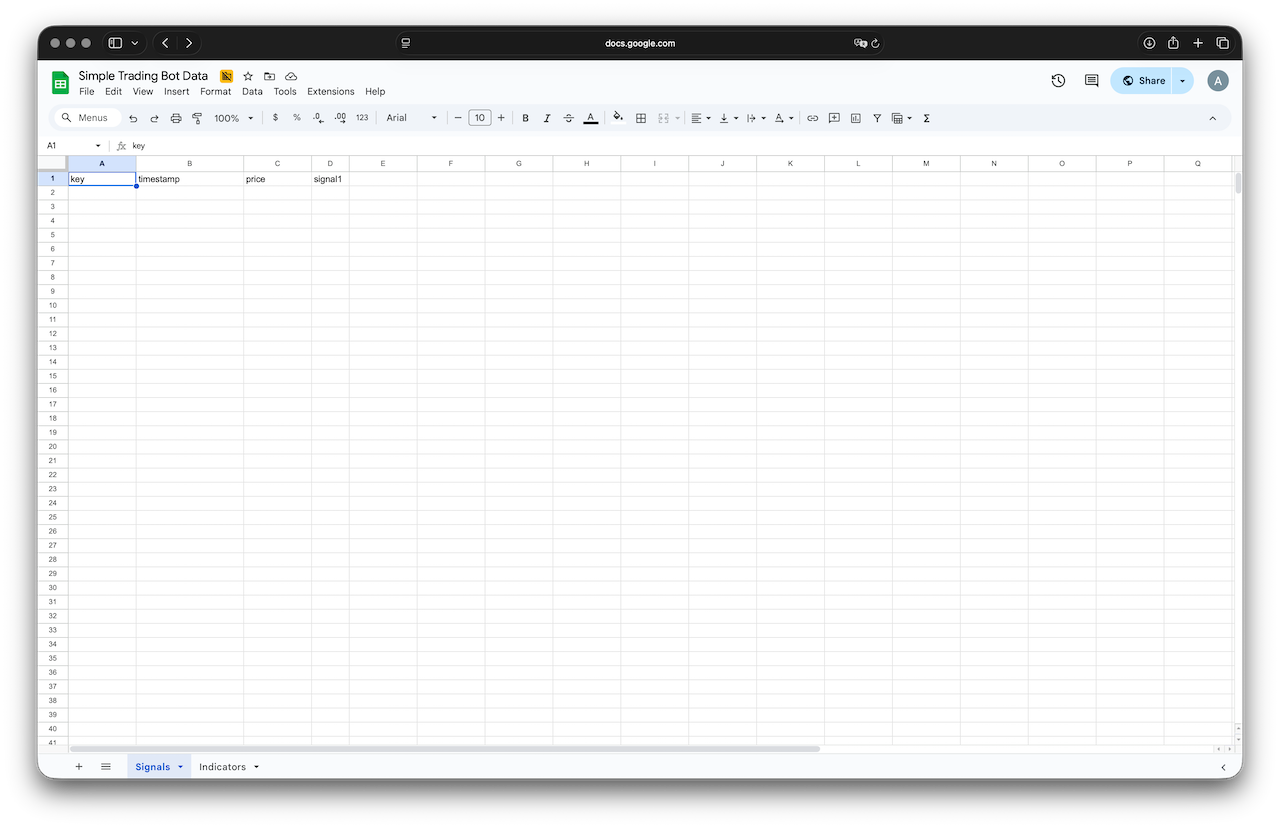
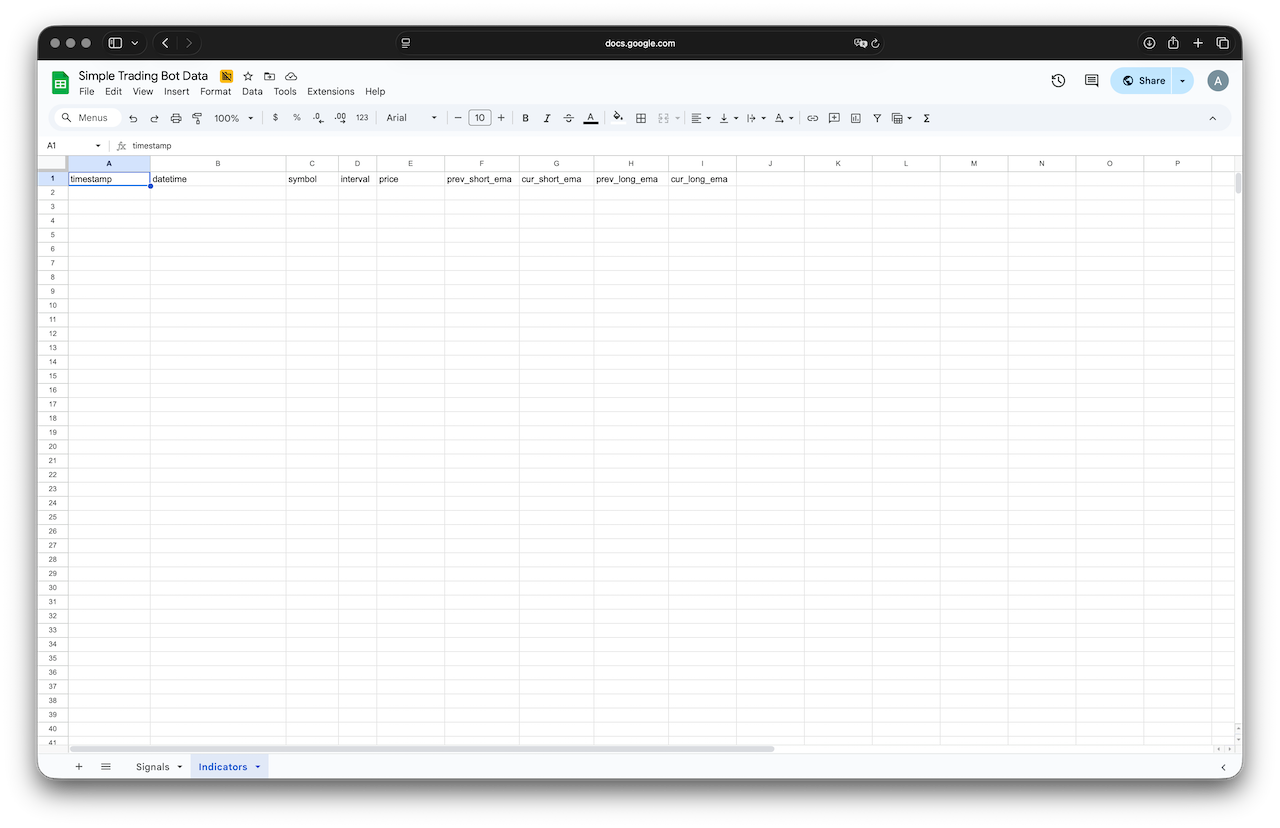
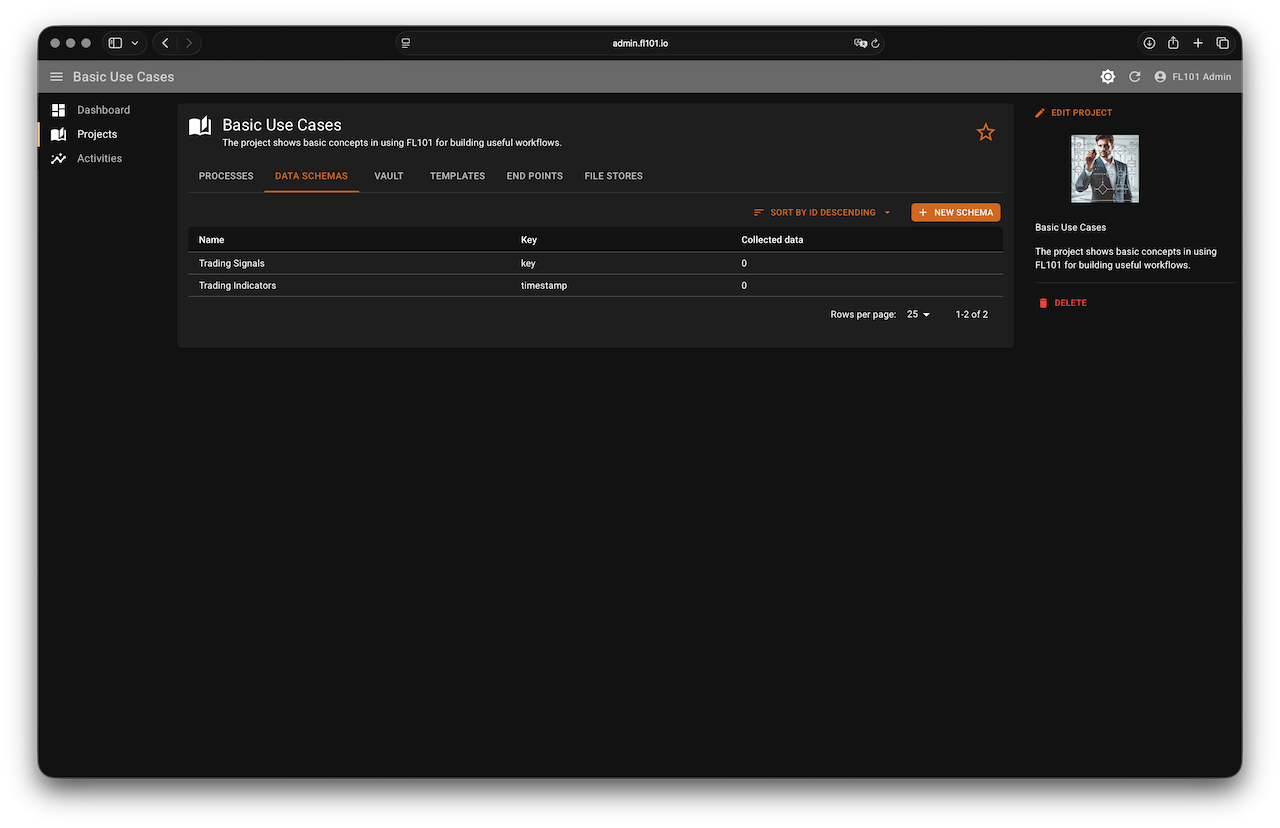
It has two sheets:
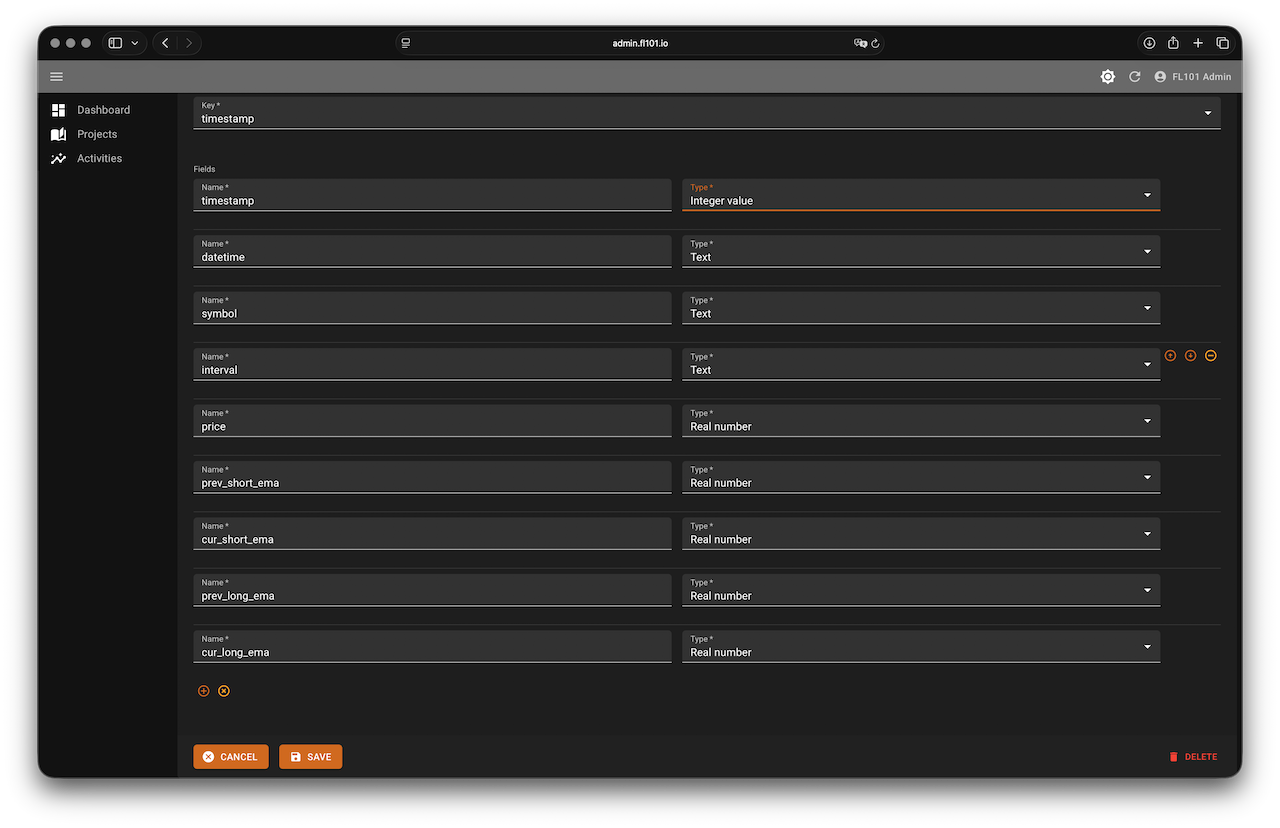
- Trading indicators – raw EMA data (filled by the Indicators process)
- Trading signals – current signal per symbol/interval (updated by the Signals process)
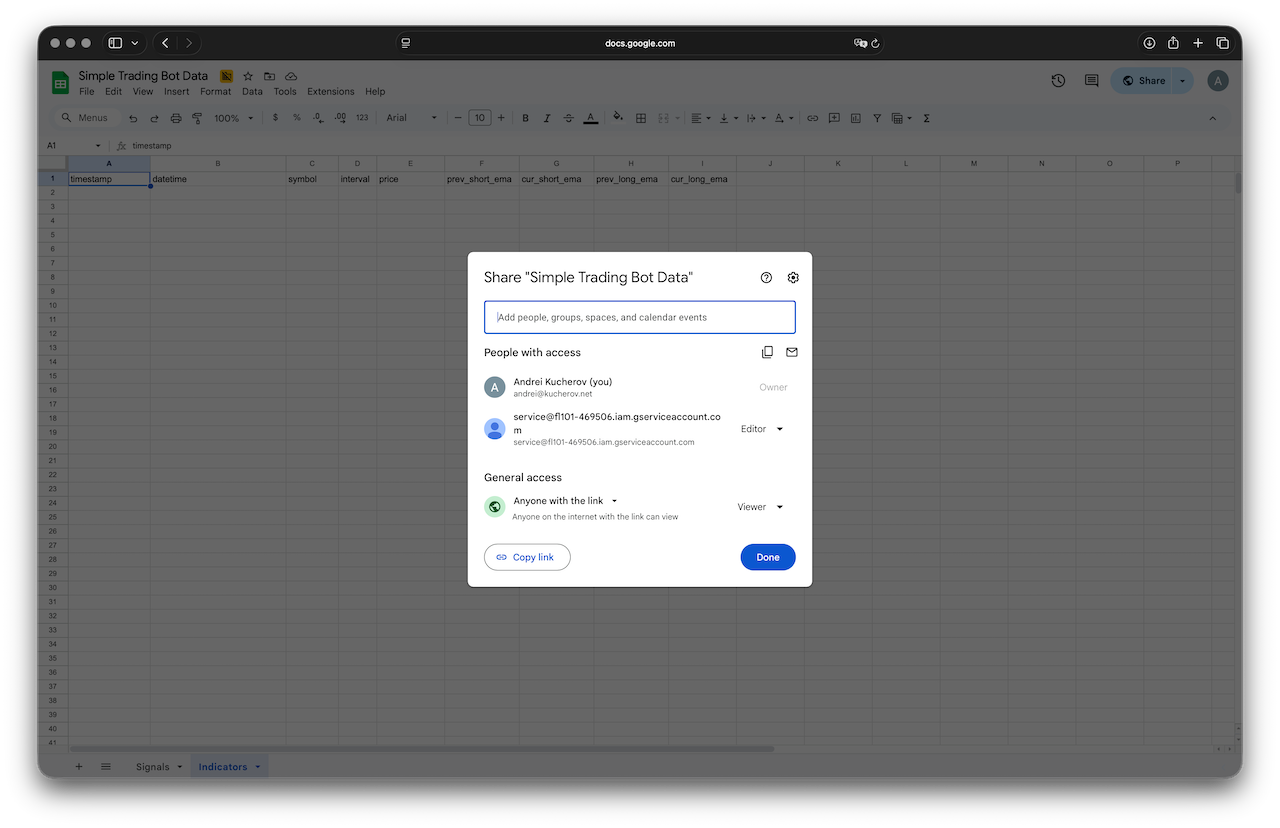
The spreadsheet is publicly readable, and the FL101 service account service@fl101-469506.iam.gserviceaccount.com has edit rights.
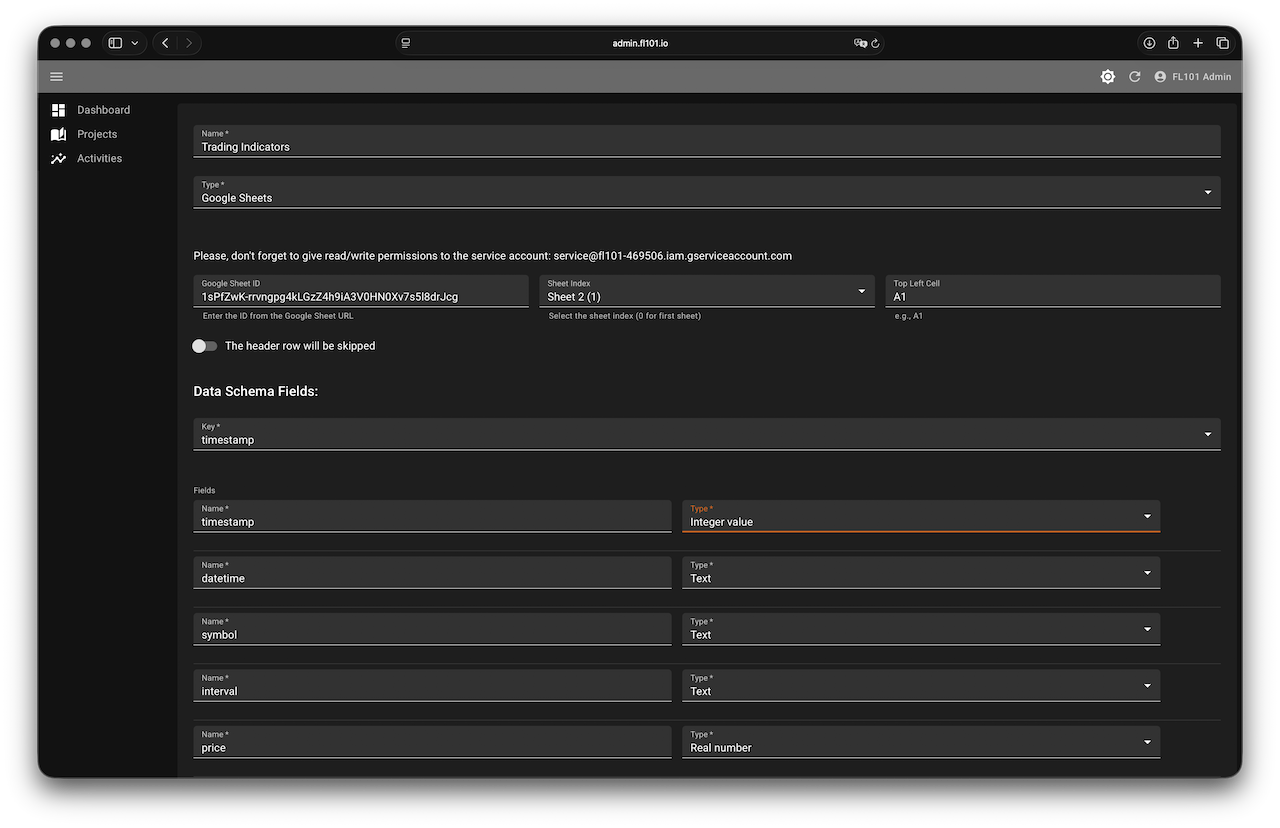
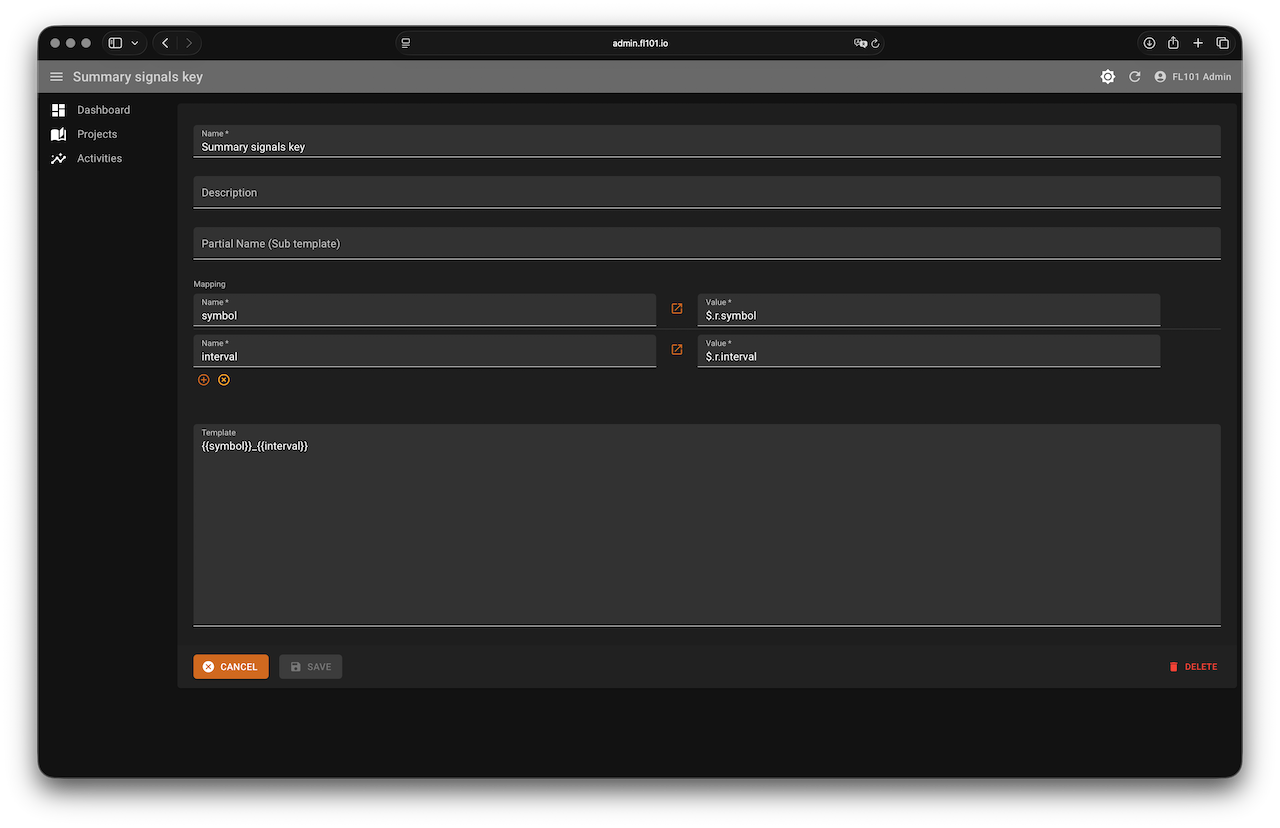
In your FL101 project create two Google Sheets data schemas (one for each sheet) with the columns shown in the sheet. Also create a simple template called “Signal Key” with the content:
{{symbol}}_{{interval}}
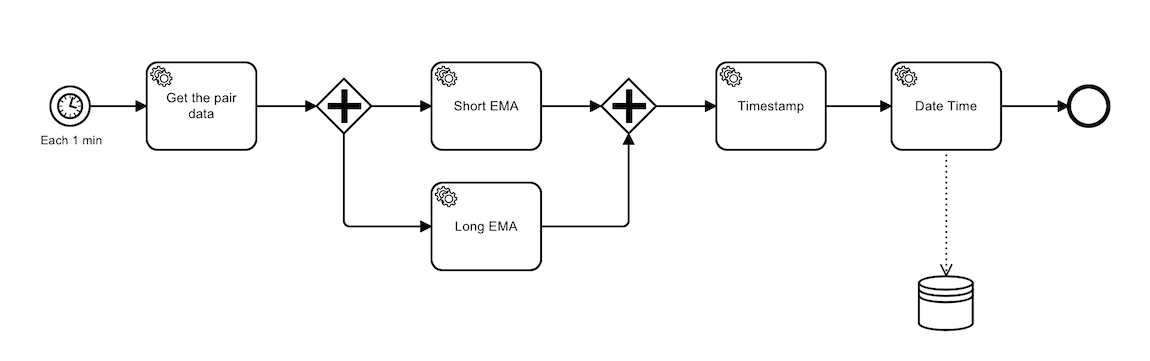
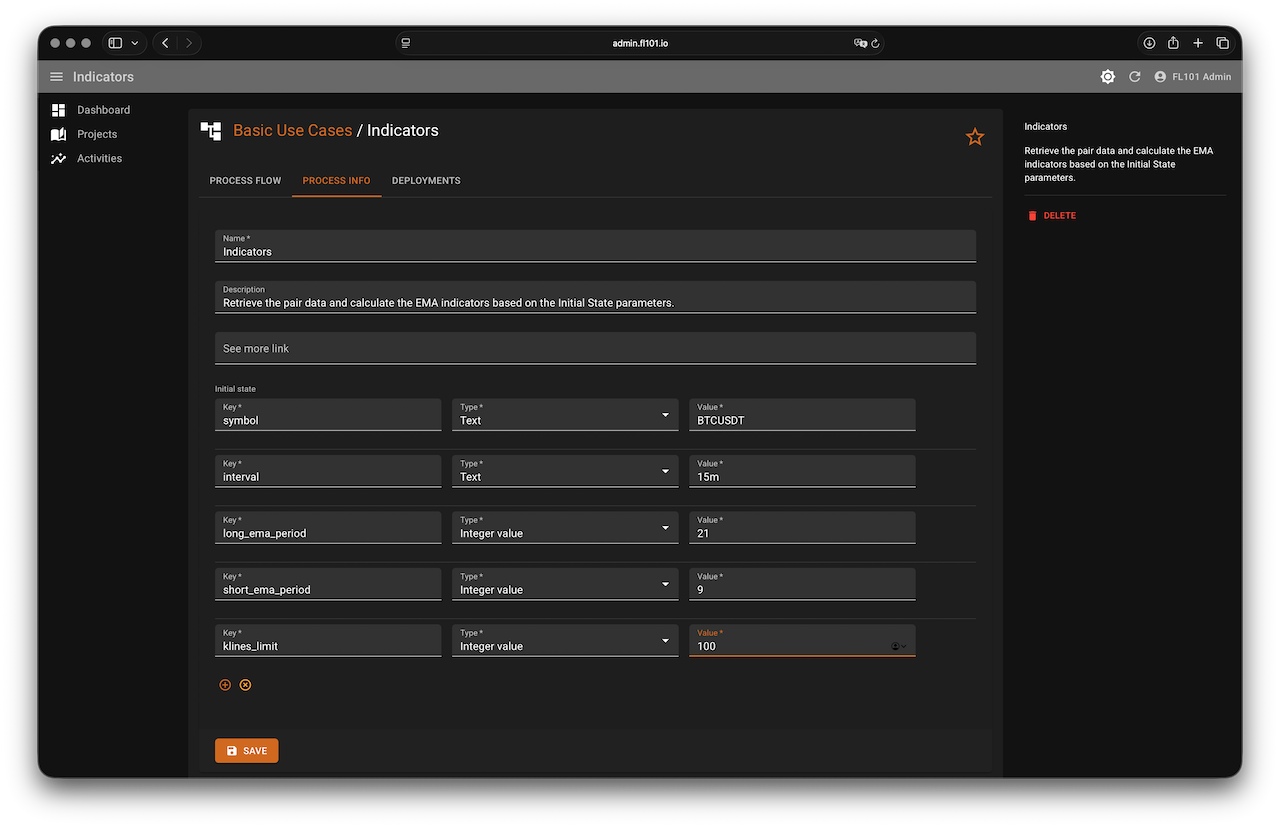
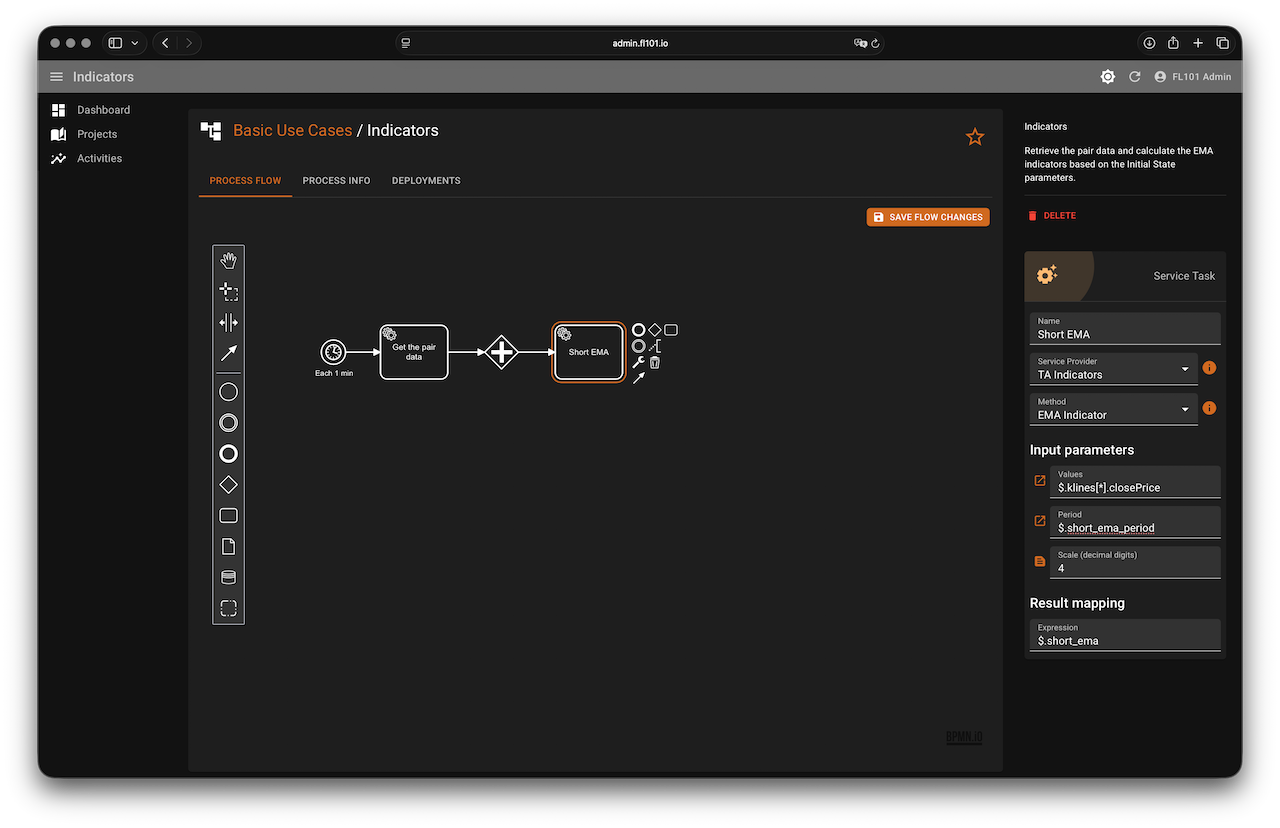
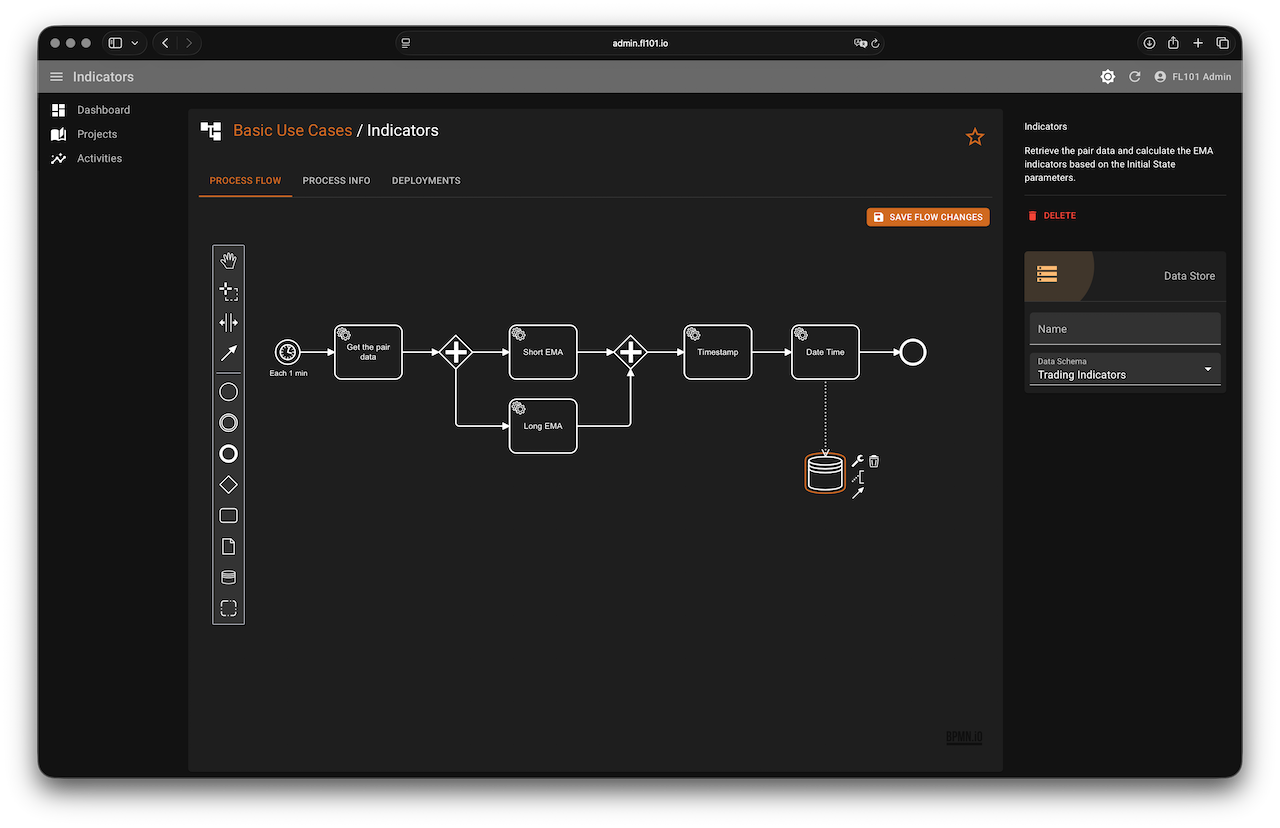
Step 2 – Indicators Process (Fetch Data & Calculate EMAs)
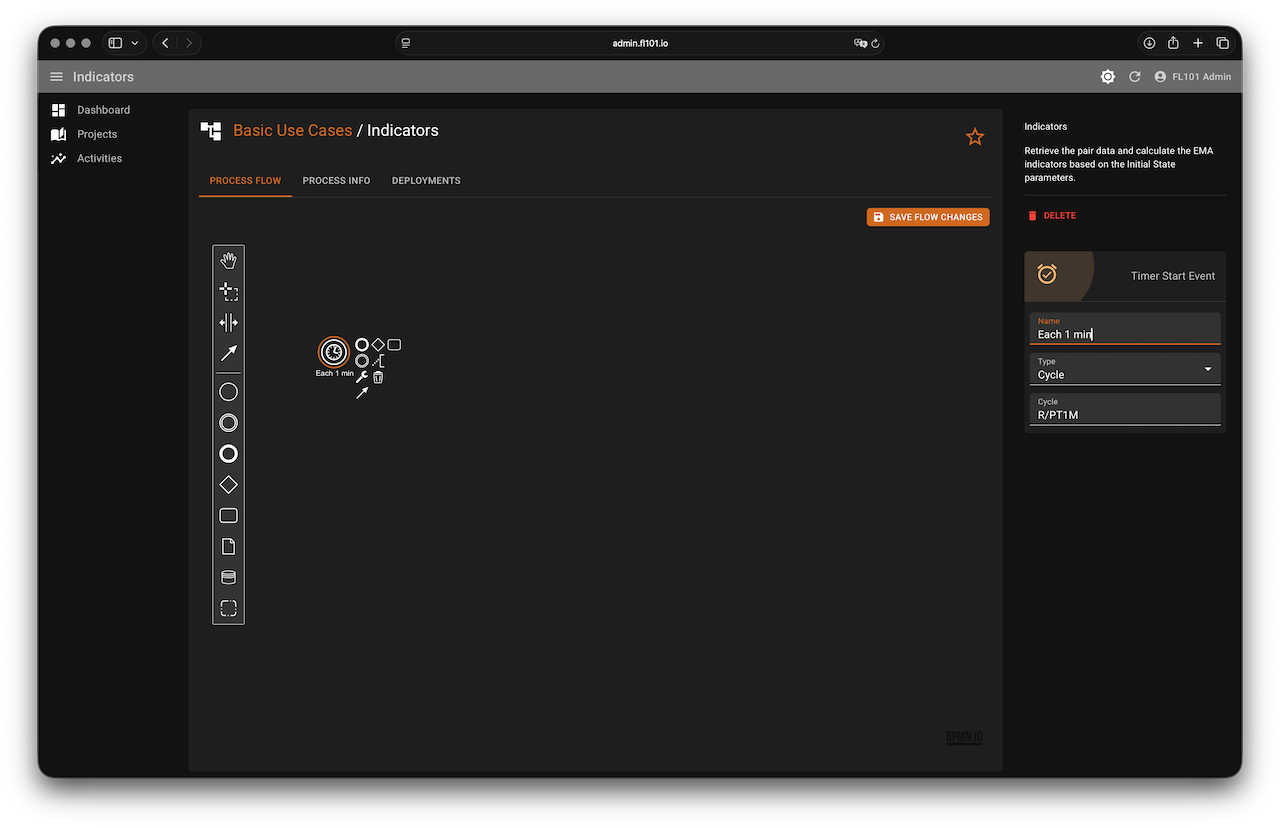
This process runs every minute and populates the “Trading indicators” sheet.
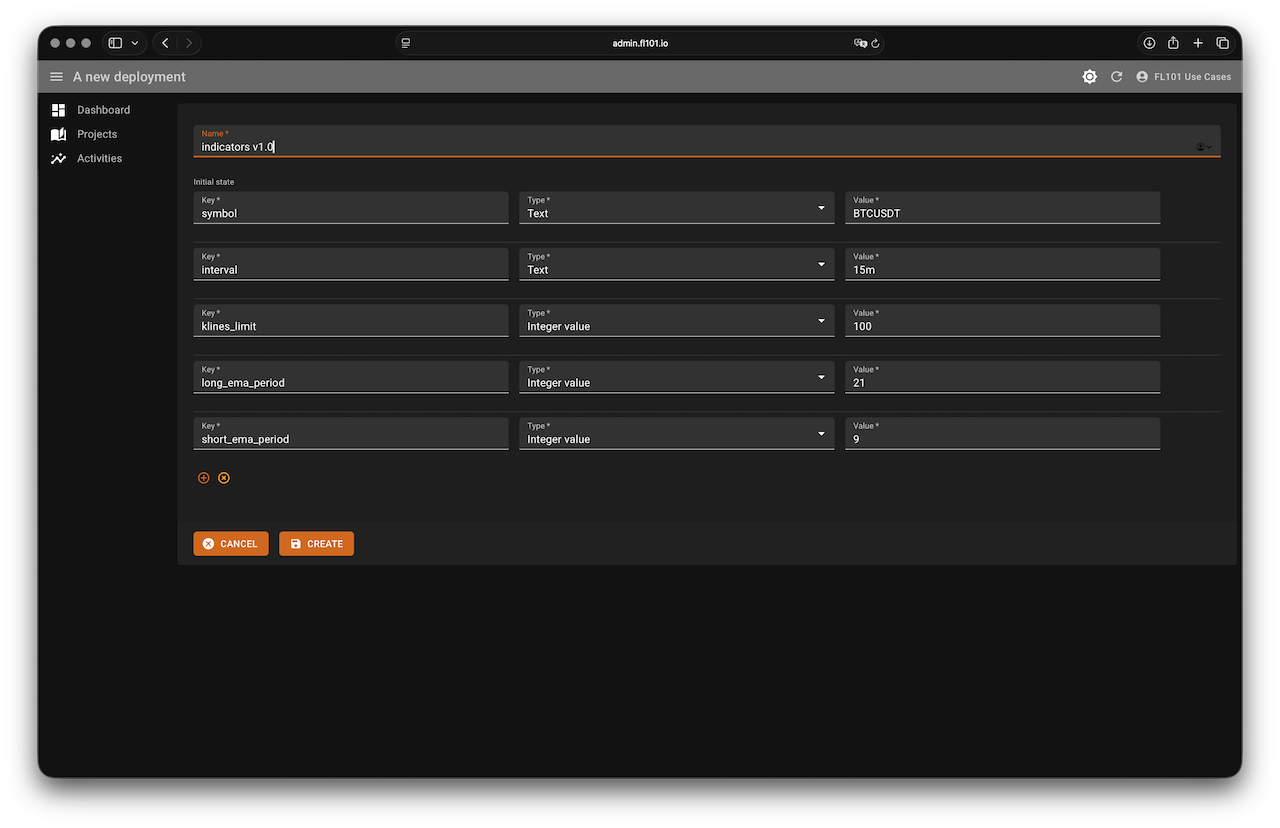
Initial State parameters (with defaults):
symbol→ Text →BTCUSDTinterval→ Text →15mklines_limit→ Integer →100short_ema_period→ Integer →9long_ema_period→ Integer →21
Flow summary:
- Scheduler → every 1 minute
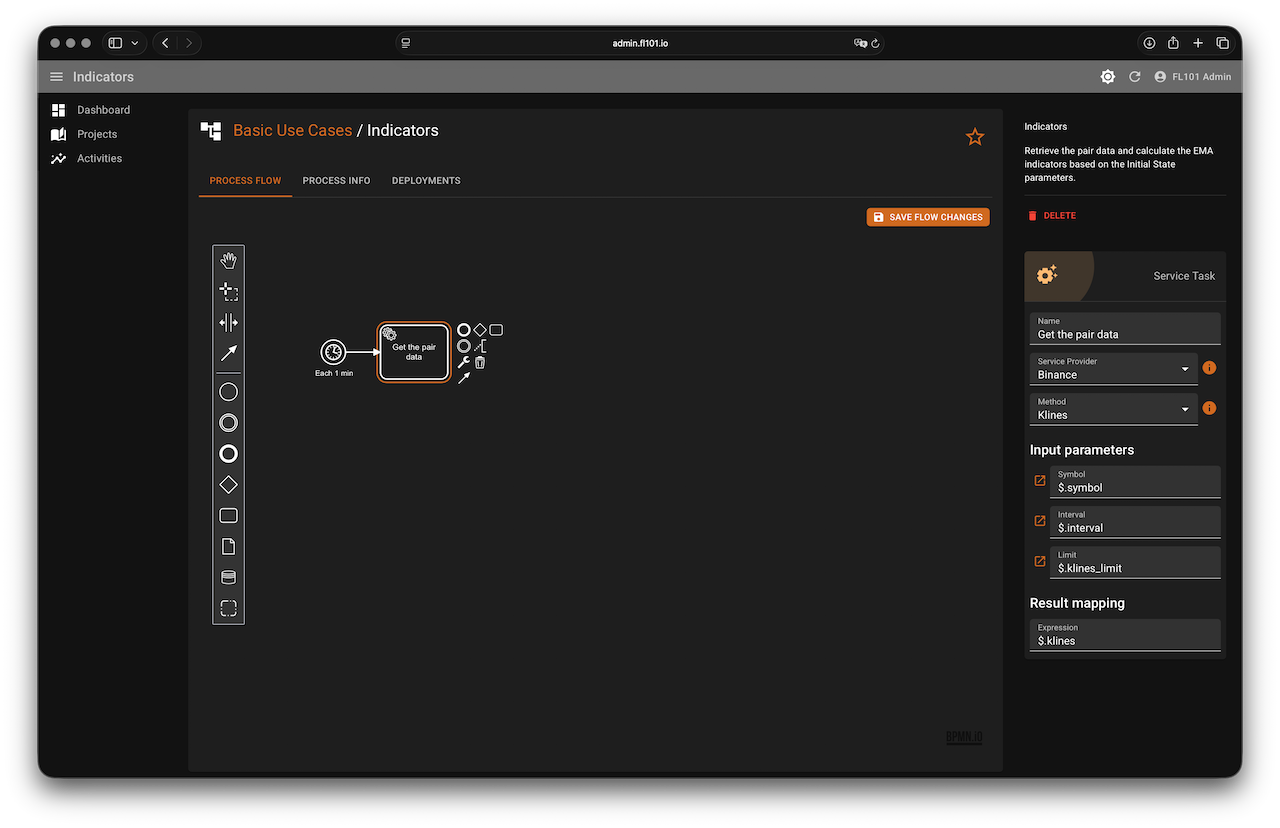
- Call Binance →
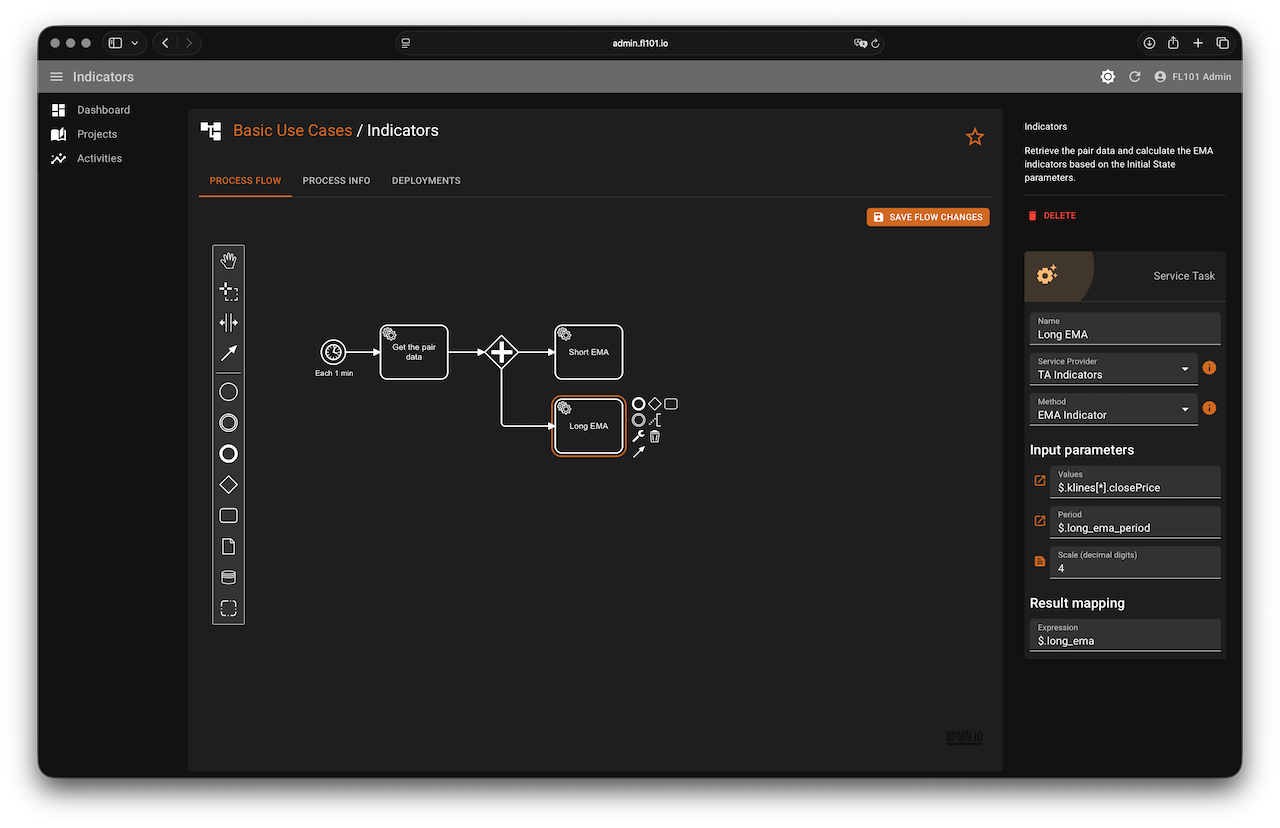
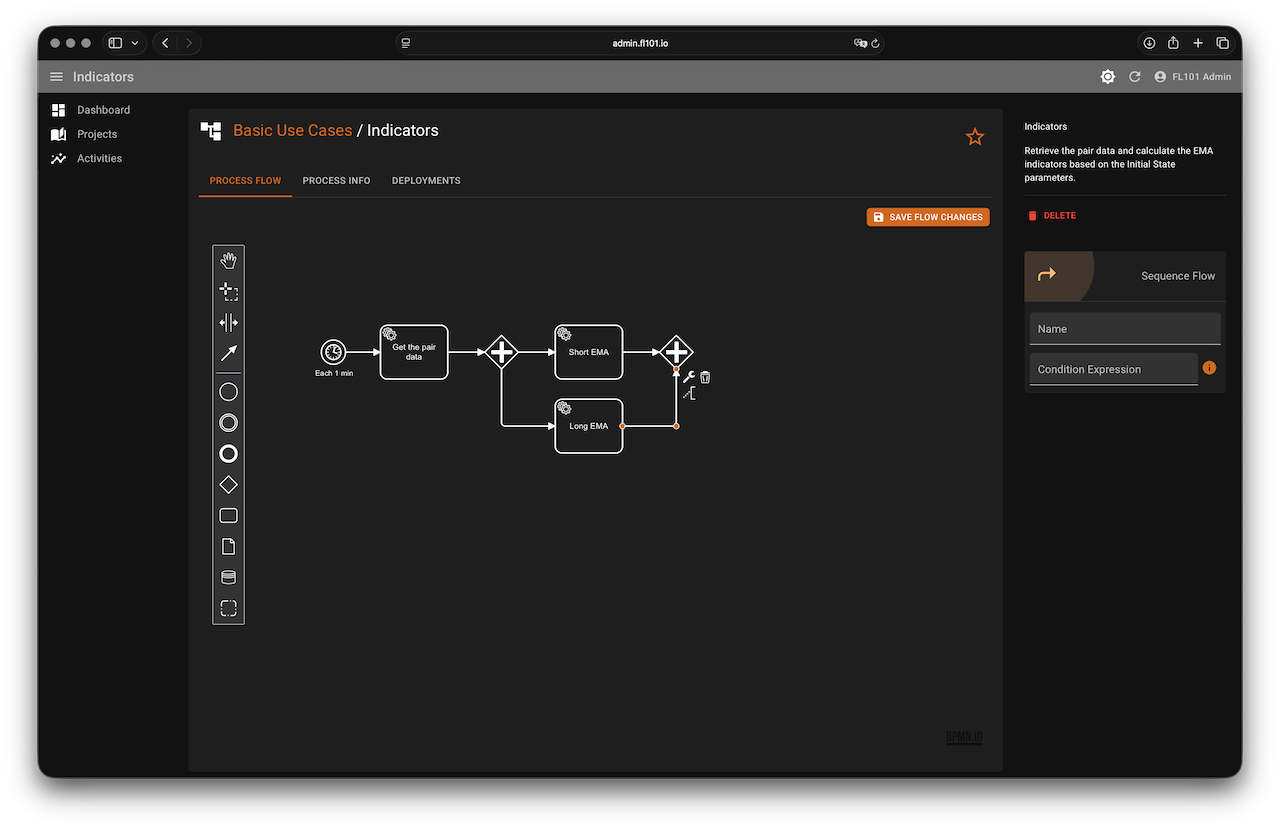
Klines(stores in$.klines) - Parallel branches → calculate Short EMA and Long EMA using the TA Indicators service
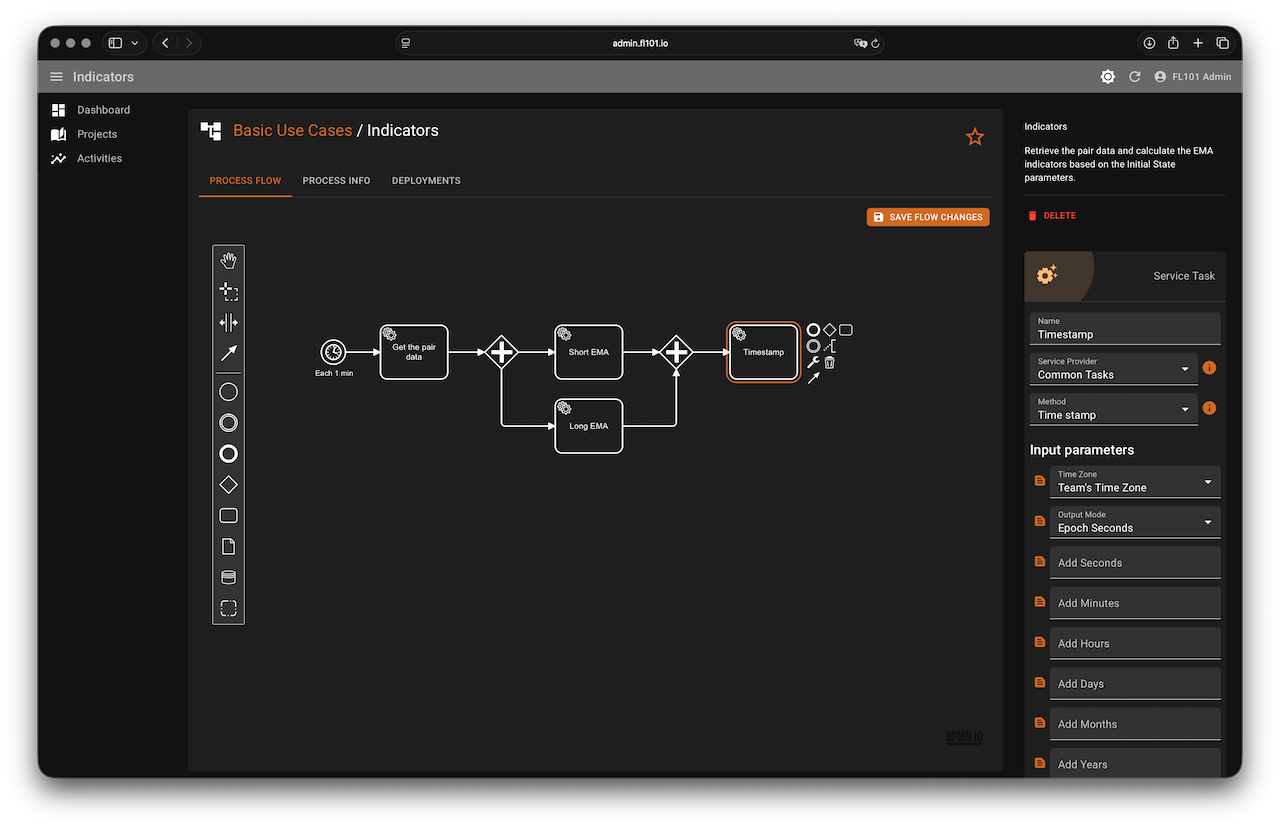
- Generate current timestamps (Unix seconds and ISO string)
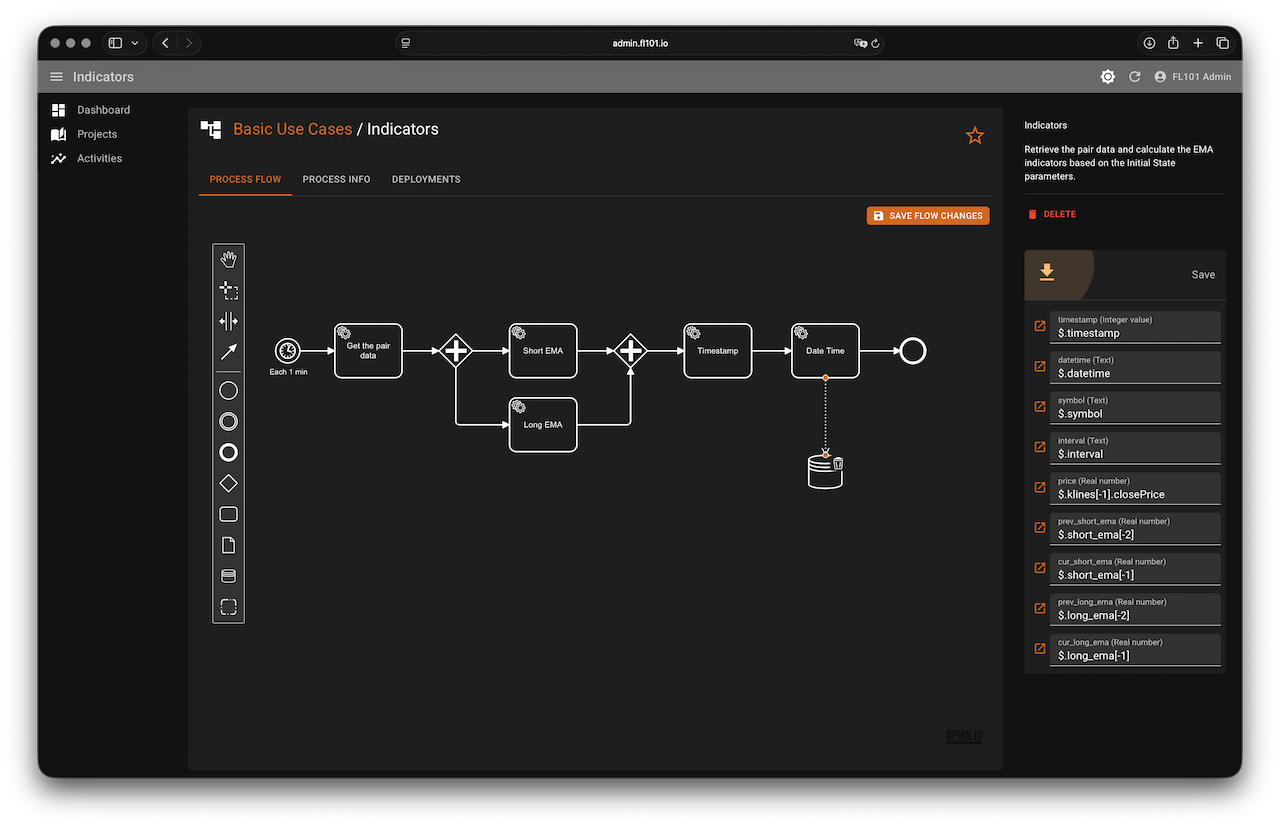
- Append a new row to “Trading indicators” with the mapping shown below
Column mapping for the new row:
| Column | Value |
|---|---|
| timestamp | $.timestamp |
| datetime | $.datetime |
| symbol | $.symbol |
| interval | $.interval |
| price | $.klines[-1].closePrice |
| prev_short_ema | $.short_ema[-2] |
| cur_short_ema | $.short_ema[-1] |
| prev_long_ema | $.long_ema[-2] |
| cur_long_ema | $.long_ema[-1] |
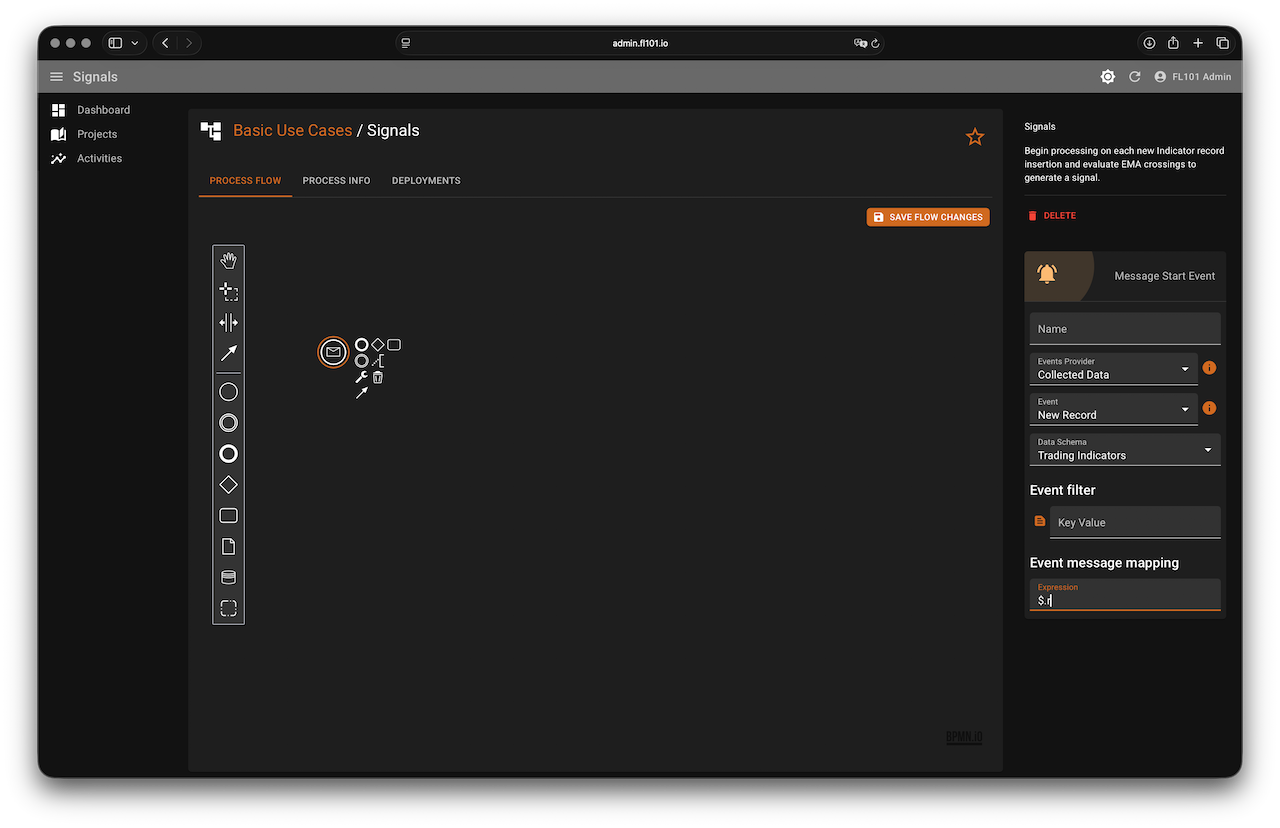
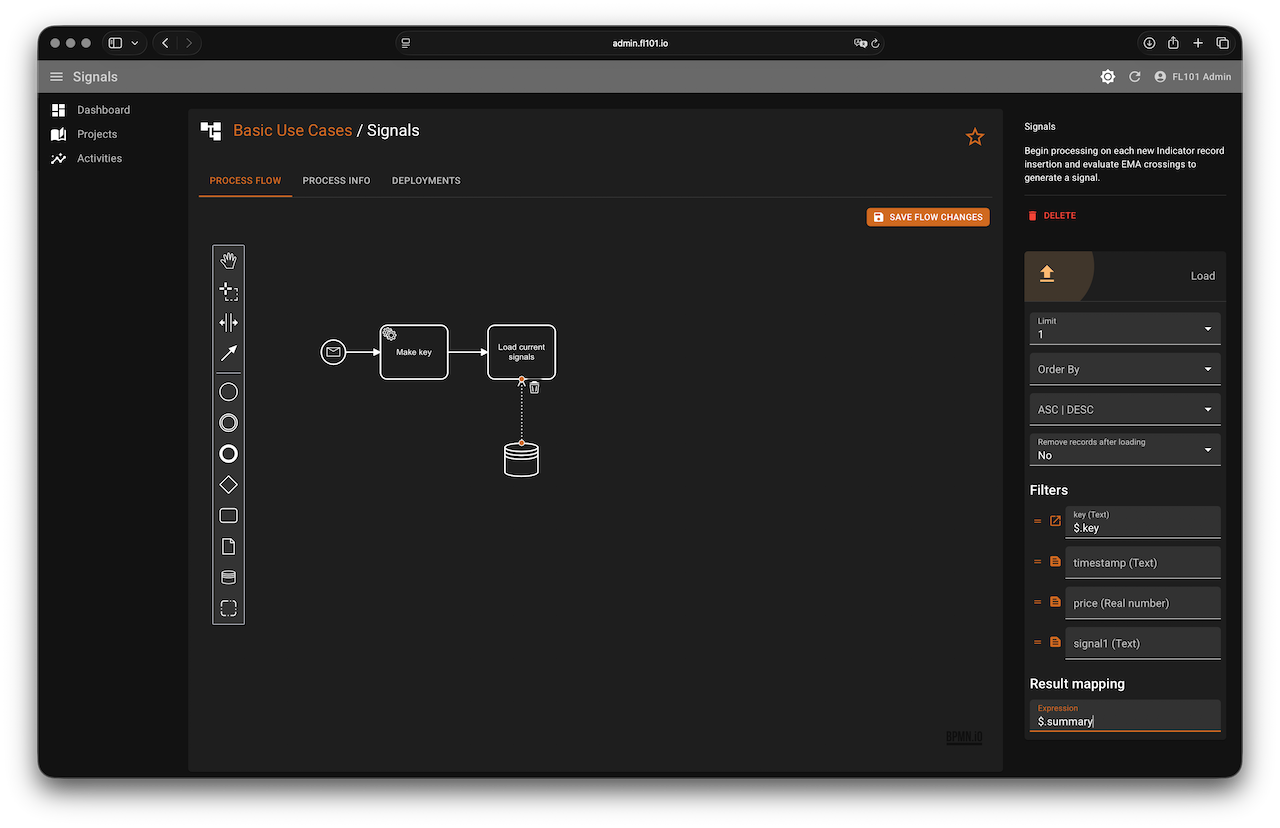
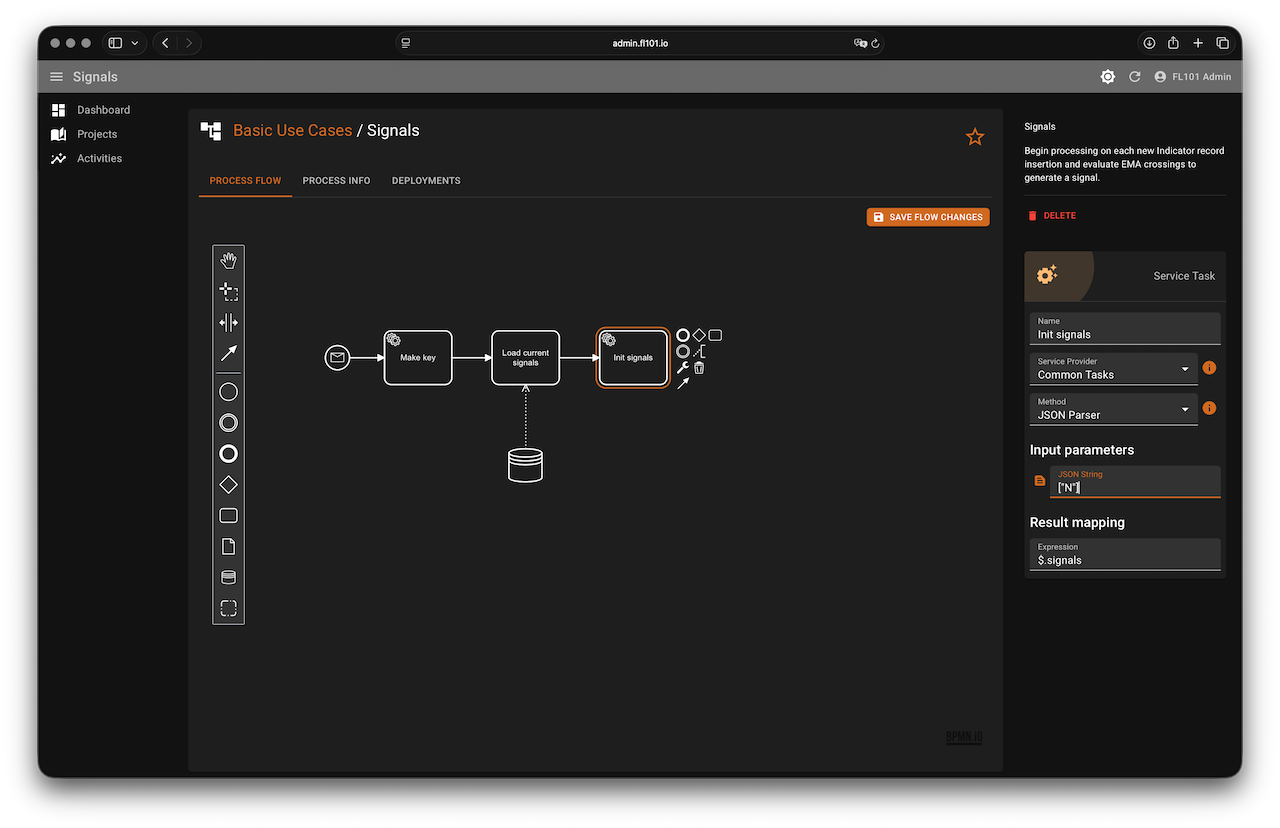
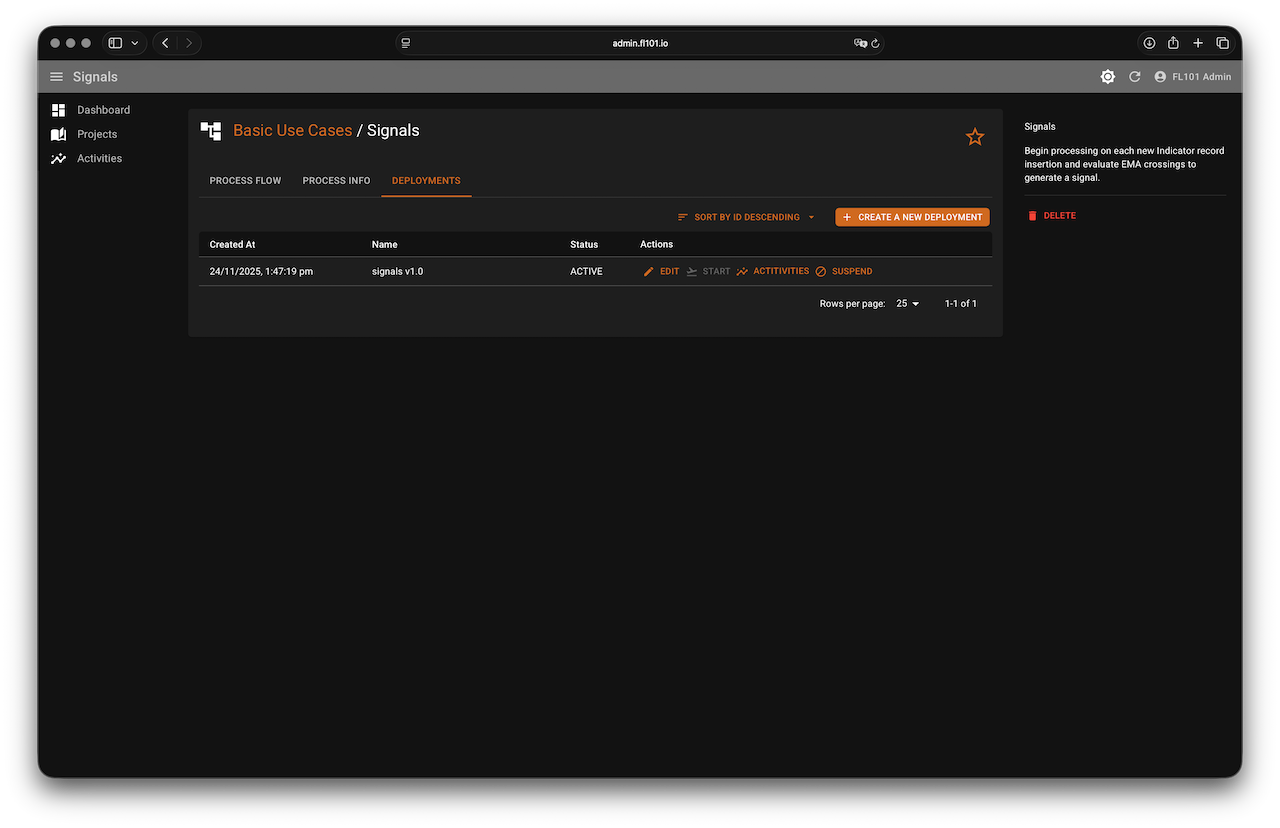
Step 3 – Signals Process (Detect EMA Crossover)
This process reacts instantly whenever a new row appears in “Trading indicators”.
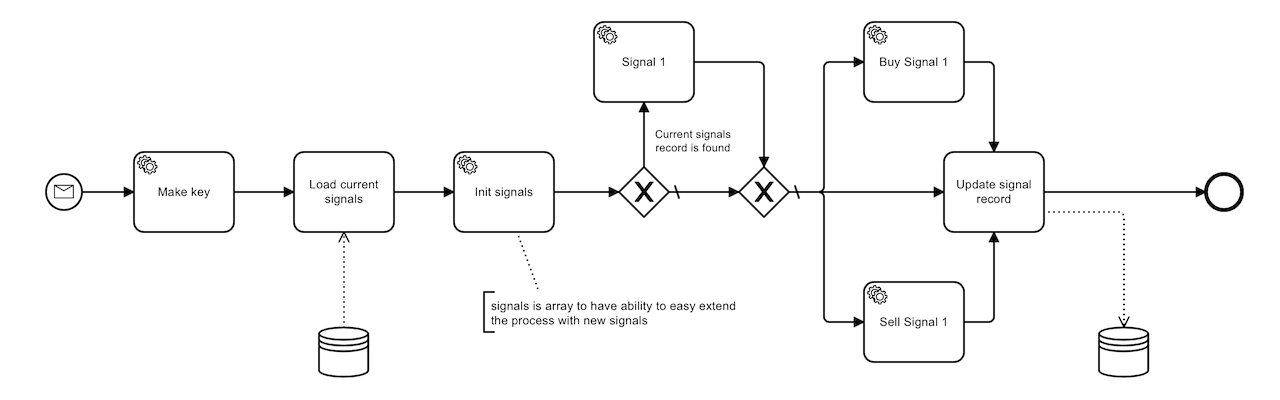
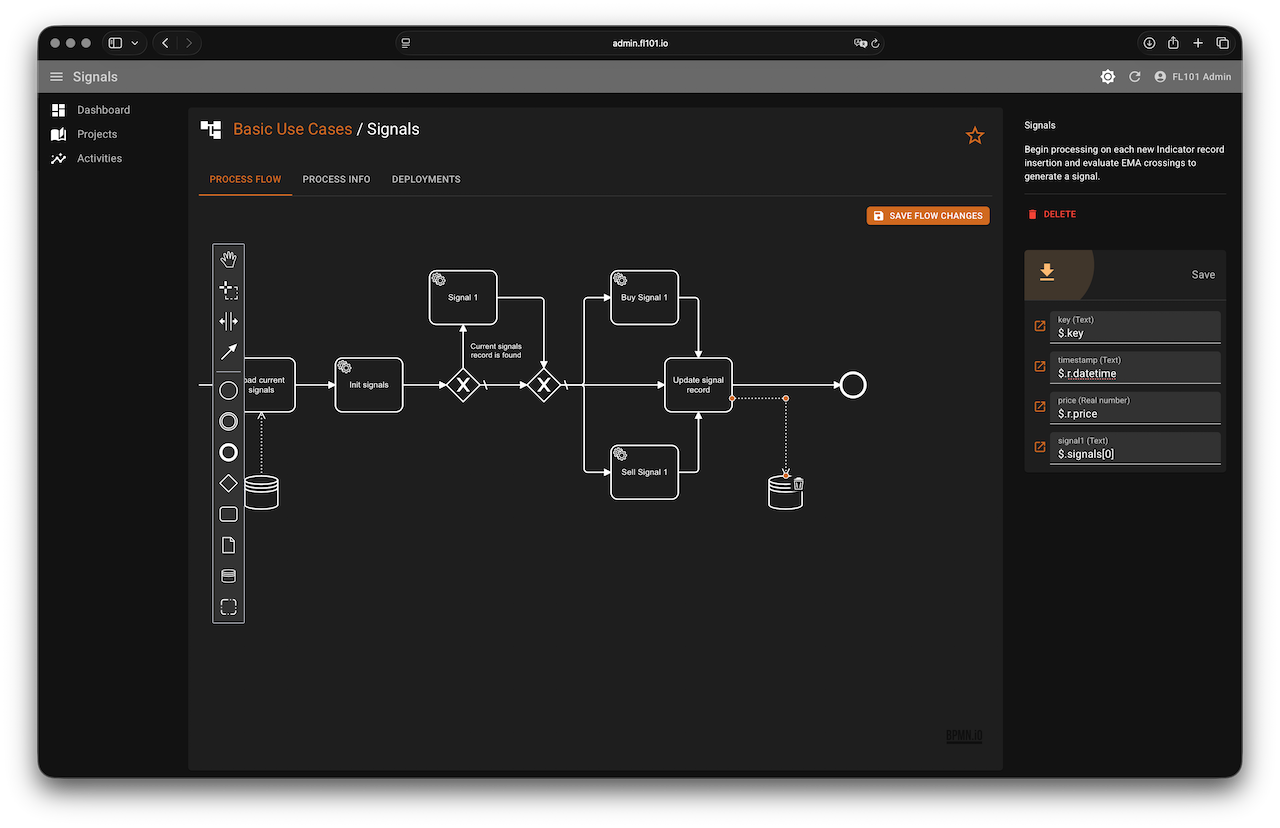
Logic (classic EMA crossover with price confirmation):
- Buy – short EMA crosses above long EMA and price is above the short EMA
- Sell – short EMA crosses below long EMA and price is below the short EMA
Key highlights of the process:
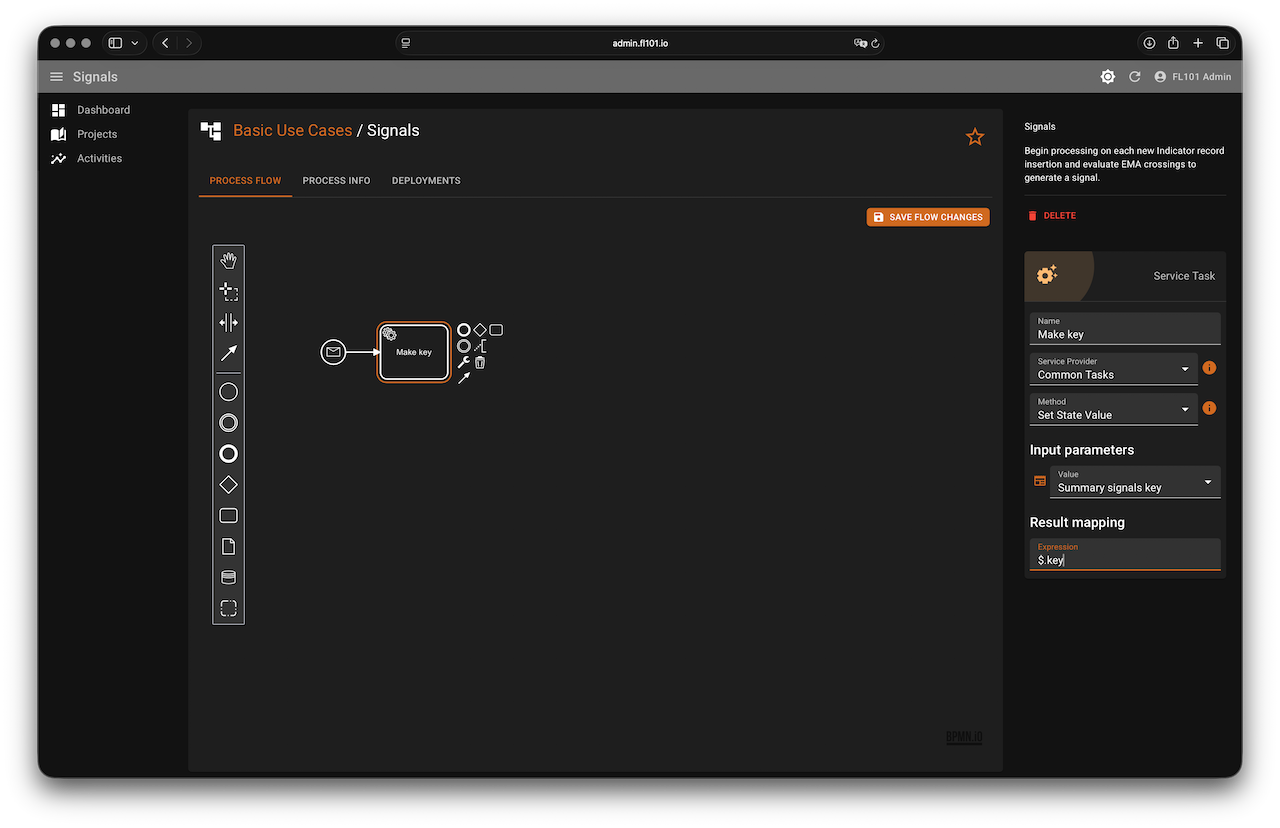
- Creates a key
{{symbol}}_{{interval}}using the template – this allows the same Signals process to serve multiple symbols/intervals from the same spreadsheet - Loads the current signal row (if exists) for that key
- Checks the two JSON Path conditions for Buy/Sell
- Writes the result (“B”, “S”, or default "N") back to the “Trading signals” sheet
JSON Path conditions used:
- Buy:
$[?(@.r.cur_short_ema > @.r.cur_long_ema && @.r.prev_short_ema <= @.r.prev_long_ema && @.r.price > @.r.cur_short_ema)] - Sell:
$[?(@.r.cur_short_ema < @.r.cur_long_ema && @.r.prev_short_ema >= @.r.prev_long_ema && @.r.price < @.r.cur_short_ema)]
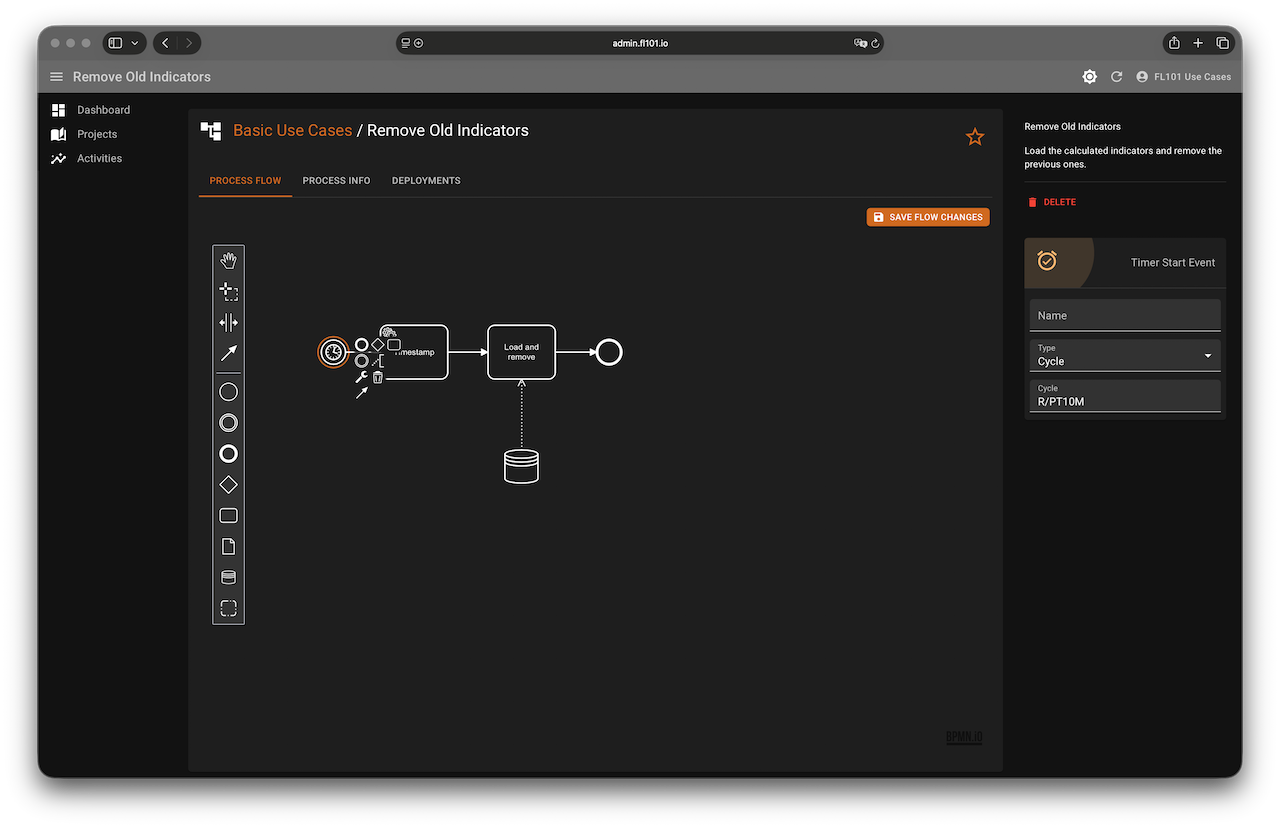
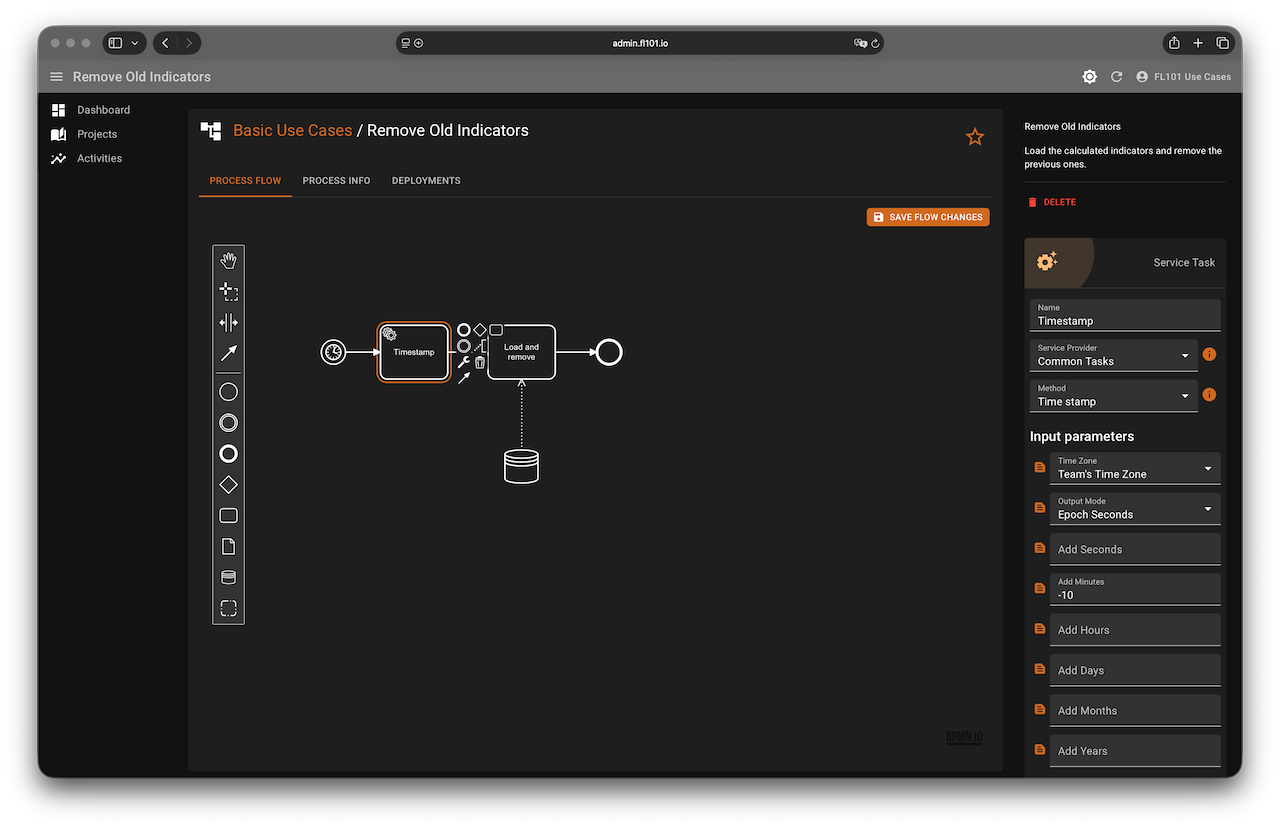
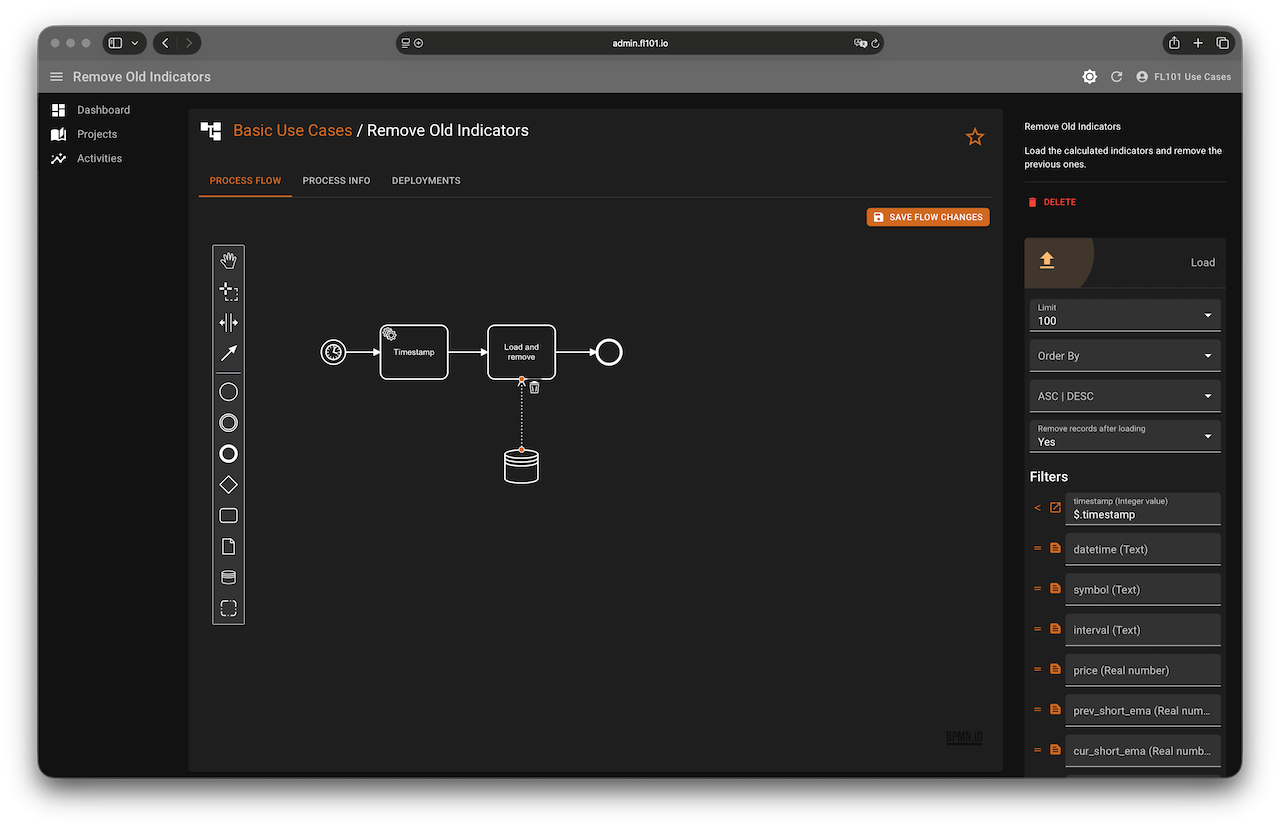
Step 4 – Cleanup Process (Remove Old Indicator Rows)
The Indicators process creates a row every minute, so we need a small housekeeping process that runs every 10 minutes and deletes rows older than 10 minutes.
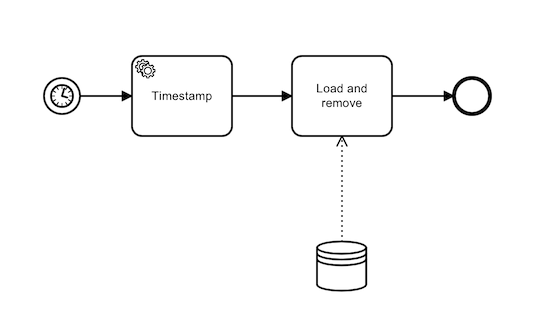
It simply:
- Calculates
now - 10 minutesas Unix timestamp and strore it in$.timestamp - Loads all rows from “Trading indicators” where column timestamp
< $.timestamp - Turns on “Remove records after loading” → old rows disappear automatically
What’s Next? Reacting to Signals
You now have real-time signals in the “Trading signals” sheet! Adding actions is straightforward:
- Create a new process triggered by Update Record on the “Trading signals” sheet
- Check the value of the
signal1column - Use the Binance Service Provider to place real orders, or simply send a notification via Telegram, Email, Discord, etc.
Because everything is split into small independent processes, adding new indicators (RSI, MACD…), new symbols, or new actions is just a matter of copying and tweaking one of the existing flows.
Happy automating – and may your EMAs cross in the right direction! 🚀
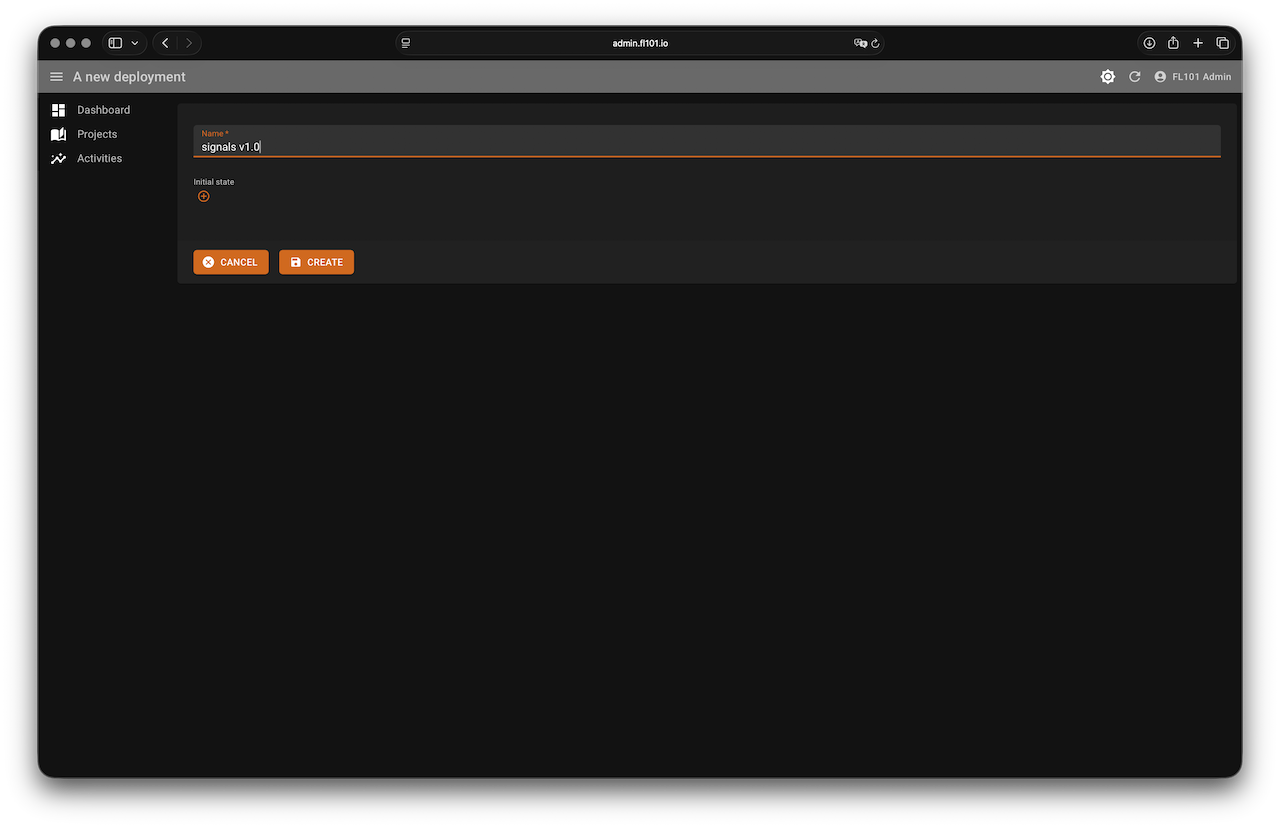
Don’t forget: Everyone who registers on FL101 is automatically added to the official “FL101 Use Cases Team”. Inside the team workspace you’ll find the complete source processes of this trading bot, live running deployments. It’s the perfect starting point for your own automation ideas!